
Acronyms
A Relative- relative consumption.
Areal real consumption.
Amax-maximum possible consumption.
A serv (t1, t 2) = serviced supply of batch n in the interval of
time (t1, t2)
Aincoming. (t1,t2) — incoming supply goods for a period of time (t1, t2)
Alost (t1, t2) — losses of demand on market during
time interval (t1, t2)
a — specific weight relative consumption
a (Engset formula) — mathematical expectation and intensity of the
batches of goods from a single source
ci — average volume of one purchase (units) in one moment of time.
Cdelay- average queue length (average number of detained batch of goods)
Closs — losses requests;
Crequest- received requests.
E1,n (A) — value of loss for the consumer system, numerical table values for the first Erlang formula.
E2, n (A) — value of loss for the consumer system, numerical table values for the second Erlang formula.
P request, — losses in the number of requests received for supply of goods,
P goods — the losses in volume of the goods,
Pt. — the losses the time of realization
p (γ> 0) — probability that the waiting time is greater than zero
p (γ> t) — probability that the waiting time of incoming batch of goods anymore t.
Pqueue — probability of having a queue of at least one consignment, the probability of the queue n
p (R> r) — probability that a length of a queue is greater of given value r
tconsum-average duration of consumption for consumers
TGD. The time of greatest demand
α- parameter of the flow of batches of goods in a free state
β — duration of product consumption
γ‘- average waiting time for batch of goods incoming on the market.
γ ̅delay — average waiting time of batch of goods the queue.
λ s (t) -а parameter primitive flows
Introduction
This book supplements the theoretical principles already published in books [1.1].
It studies the issues that arise at various stages of functioning of the market and offers their solutions by using methods of the mass service theory. The application of the proposed mathematical methods enables rigorous calculations of the desired parameters.
At the initial stage of introduction of goods in the market arise questions.
1. The value of the demand for this product
2. Possible revenues.
3. The reliability of the repayment of the loan (in the case of receipt).
At the stage supply of batch of goods need consider the competition.
1. How affect, the behavior of market competitors (the increase of the supply of goods or their reduction).
2. The effect on the demand the appearance on the market of new competitors.
3. As the influence of external factors (disasters, weather, etc.).
4. The pricing policy. Interest rates, money supply.
5. Different properties of the market.
We are considering the properties of the market.
1 Number suppliers.
2. The uniformity of the delivered goods.
3. The dependence of demand on moment of time.
4. The discipline of service of goods — no accumulation of unsold goods or saving their in warehouses
5. Strategy of providers in case of overproduction
The solution of these questions we will consider in the following order.
1. First, we will analyze the proposed mathematical model, which will congestion, determination of the necessary number of buyers
2. We will define what is a product and enter the basic unit of measure that will allow us to analyze any goods.
3. Consider formulas that allow you to determine the characteristics of supply and demand for a given network.
4. Consider examples of solving problems for specific markets (for example, the calculation of the oil market, the prevention of market overload, determining the required number of buyers for a given percentage of losses).
Chapter 1. The initial concept
1.1. A mathematical model of the market
Definitions
For the mathematical evaluation of processes in the economy it is necessary to create a model that would reflect them in mathematical form. In conjunction with the definition of units of measure of supply and demand — relative consumption, this model allows to obtain and to provide a quantitative calculation, analysis and assessment of possible market behavior. The proposed model is shown in Fig.1.1.
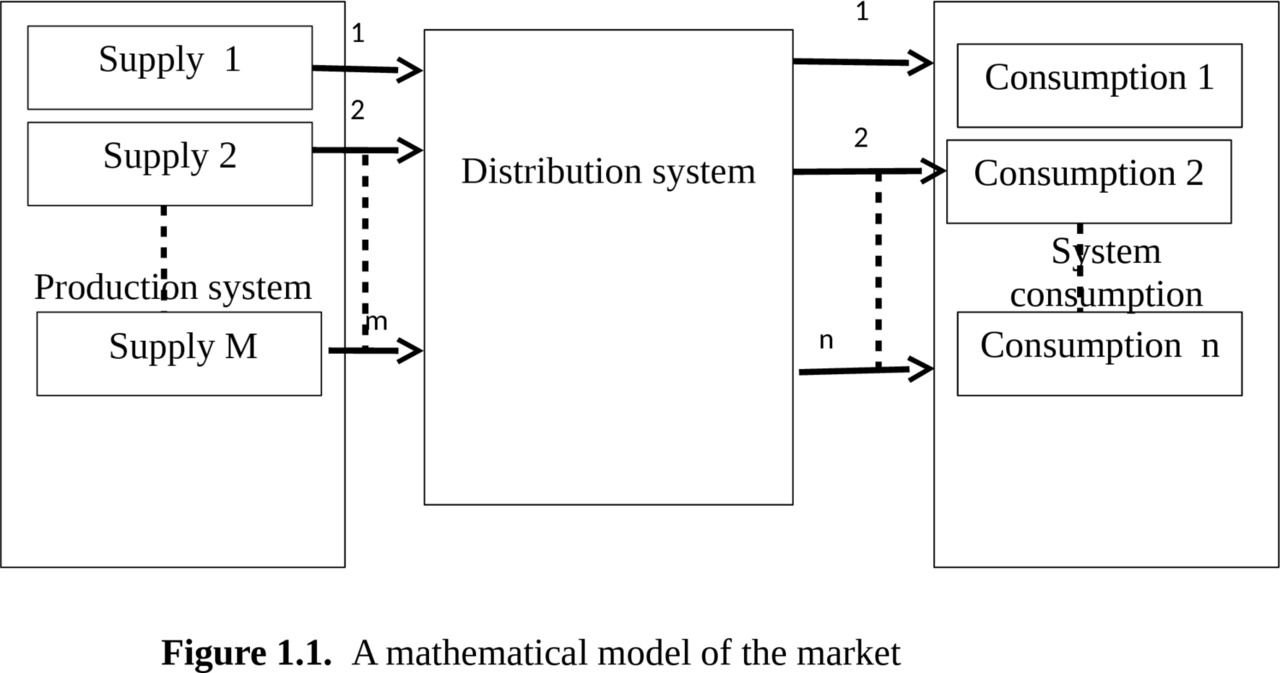
The market contains subsystems that perform the following tasks
Production system — generates random flows of goods (in general case different from each other). Under the goods refers to any product or service offered for sale, in which there is a need (in the following we will show how to define the demand in numerical form). These can be food items, for example, as milk and other food products, cars, homes, cleaning services house, stocks, a construction company offering services in construction of houses, etc.
Flows enter the distribution system.
The distribution system can the request handle immediately or with some delay. The refusal can be of two types:
— the refusal to accept the goods because of lack of demand;
— or installation on waiting of implementation (accumulation of goods)
There are two types of distribution systems.
First type performs the task as quickly as possible to sell the goods without any additional conditions. In queuing theory, such a system mass service is called “full accessibility system” because it provides equal access to the system of consumption, and this system can be not taking into account for calculation of behavior of the market.
Systems of the second type, distribute the goods, given the specified priorities and limitations for individual consumers or consumption. For example, the sale of tobacco, alcohol, weapons… systems of this type are called with not full access.
If the order is accepted, the distribution system is trying to give its to consumers to the consumer network
In our model we have included in the distribution system is an important point, which consists in the ability to influence the demand by setting prices (commonly given with the consideration the price of the manufacturer).
The price may limit demand (privileged goods) or stimulate it (discounts, sales, or other action).
Consumption system serves the flow of goods. This is reflected in the fact that individual consumer or group of consumers can buy the offered goods or to refuse from the purchase. Incoming goods can be purchased, any free group of consumers.
If all consumer groups are busy, then the system of consumption is refuses from the purchase of goods, i.e. appear goods losses. State busy — we will name situation when group of consumers, which during the observed period of time, has acquired the maximum possible the quantity of goods and withdrew for some time from consumption.
Not purchased the product can be not offer, for example, to destroy — it named obvious losses. This type market are named a system with obvious losses.
Distribution system can put the product to the queue of waiting for the realization (for the accumulation and, storage of products). This type market is named a system with waiting.
In this case it is important to know the waiting time. It may exceed a reasonable time (the assigned waiting time). In this case we speak of conditional losses. Since the goods available for sale and after a certain time is removed from storage in accordance with agreed terms and conditions.
If the share of refusals of the goods received exceeds a certain number, it indicates overproduction, and requires measures to eliminate such losses.
1.2. Relative consumption. The unit of measure of supply and demand
In order to apply the methods of Queuing theory to the calculation of the basic economic processes, it is necessary to solve one of the key issues of the economy — to determine the product unit measures supply and demand (A-relative consumption).
Let’s start with a quote of Keynes [3.1].
“The difficulties that most bothered me at process writing this book, and I couldn’t clearly articulate their thoughts;
first, the choice of units measurements, suitable for research of economic system as a whole;…”.
“That the units, in terms of which economists commonly work, are unsatisfactory can be illustrated by the concepts of the national dividend, the stock of real capital and the general price-level:”
“The community’s output of goods and services is a non-homogeneous complex which cannot be measured, strictly speaking, except in certain special cases, as for example when all the items of one output are included in the same proportions in another output”.
We will try to find an indicator of demand. Let’s call it the relative consumption. – A Relative
He can to acquire the following extreme values.
If the consumer has satisfied his need for this product, P Relative =1,
If the consumer is just starting to buy a goods P Relative l=0.
Let’s is use your experience.
Do you love cakes? I will sell them to you. You will buy them and will desire buy more. I’m going to sell more and more. Finally, you will begin to eat 10 cakes a day. And I offer you still. You say, “Enough!”
I suggest to You free of charge for 12 cakes a day, and You ungrateful saying “No!”. Moreover, buying cakes, You will some time to consume them, and not buy a new one.
What is it? It is the overproduction!
So the current state of the user can be reflected by the value of the relative consumption
0 ≤ P reliative ≤ 1
Let’s continue the search for the mathematical determination of relative consumption.
Introduce the unit (let’s call it a) that will allow us to measure supply and demand “relative consumption”.
It is the ratio of real consumption Areal to the maximum possible Amax
It will ratio
Arelative. = Areal/ Amax.=a
For most of the considering cases we can assume that prices Areal and Amax are equal so the relative consumption is a dimensionless quantity.
When determining the maximum consumption, we assume that no material (money, prices) and external factors (season, fashion) do not limit the consumer. Then the maximum consumption in a given period will be equal to Amax.
Maximum consumption can be standardized (for example, by analogy with the consumer basket). However, it should be noted that the maximum consumption may change in time.
For example, the maximum demand for the commodity “money” may increase depending on the achievements or expectations (the promotion) of technological progress.
The actual and maximum consumption expressed in units of the product (pieces, packages, units of money).
If we use this unit we will for measure the demand and supply of goods, by one consumer or one group of consumers, then we will call this index — SPECIFIC WEIGHT RELATIVE CONSUMPTION and we will denote it a.
If we considered the consumption of a group of n consumers (consumer groups), applied the name RELATIVE CONSUMPTION
Arelative= a×n.
In detail, the influence of the processes of functioning of the market for relative consumption (objective, subjective factors, price) considered in [3.1 — 3.3].
Chapter 2. The market as a system with obvious losses. Basic concepts
2.1. A mathematical model of the market as a system with obvious losses
In this Chapter we consider methods for calculating throughput of market with full accessibility in the system with obvious losses.
We will consider a simplified mathematical model shown in Fig.2.1.
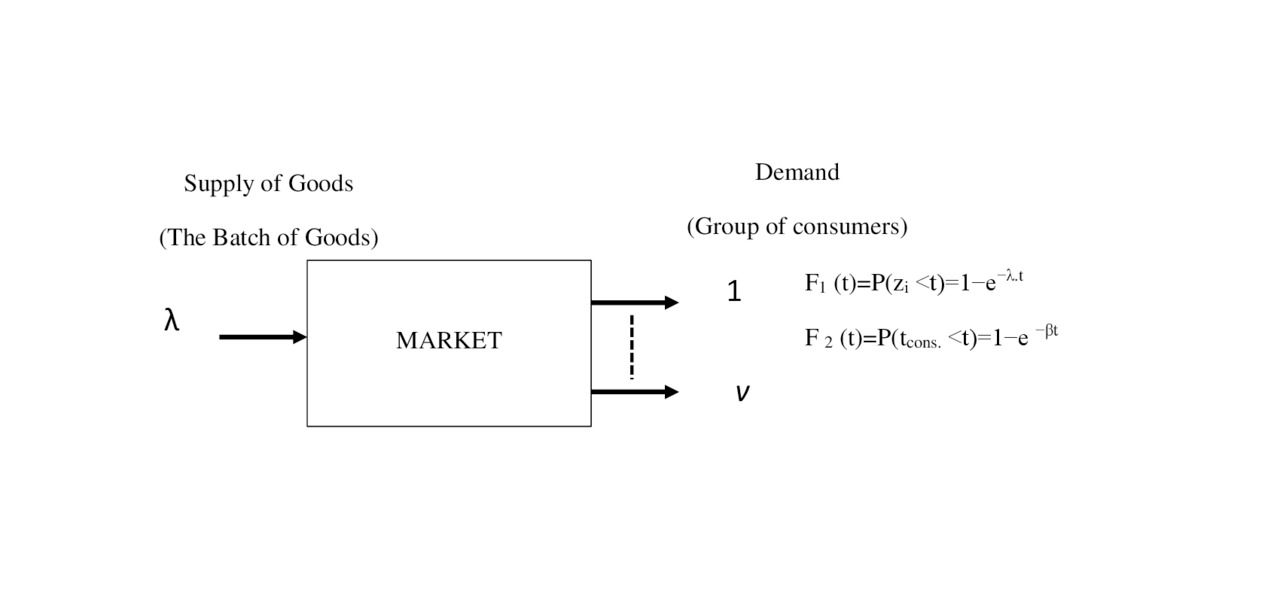
In this model, is considered
— the incoming flow of goods, from the system of production
— the flow then enters the distribution system.
— which delivers it into the system of consumption.
The main assumptions which allow to mathematically investigating this process.
Incoming flow:
— consists of identical goods, (this property is named ordinariness)
— result processing of the goods in this moment time does not depend on the results of previous processing (this property is named stationary);
— follow processing of goods the does not depend on the results of previous processing (this property is named the lack of aftereffect).
Random flow, which has all three properties, is called the simplest and well-studied in mass service theory [2.1, 2.2, and 4.3].
The market distribution system
It is assumed that this system has no any stimulating or limiting effect on the service process goods
The system of consumption operates as follows.
The system consists of n groups (or individual) consumers.
Each group receiving a certain amount of goods and after out some time (time of consumption — tconsum) and may be free for further consumption.
For example, a consumer who bought a vehicle, uses it (consumes) for about 3 years, and then begins to look for a new one.
Not to be confused with the time of consumption and time of possession. User has
the old car, but as soon as he begins to look for a new one car — this point is the end point of consumption.
If satisfied demands one of a group of consumption then the number of groups decreases by one, i.e., for consumption remains n-1 group.
At high intensity can be that there will come a time when all n groups of customers will busy.
Whereupon, the received goods will not be sold. Unsold merchandise we will call a LOSSES.
The probability of losses of the goods with a certain number of receipts and number of groups consumption, can give answer one or more questions.
For example,
1. At what size supply, losses will exceed a given norm?
2. What number of goods can processing the market in a given time?
3. How much should be consumer groups to ensure that given quantities of goods were sold with losses less than or equal to the specified norm?
4. What happens to losses if we increase the supply at a certain value? The appearance on the market of new suppliers or an increase in the supply of production.
The answers to these questions can be found by applying the formula of Erlang.
2.2. The first Erlang formula for the calculation of market indicators
The first Erlang formula has the form.
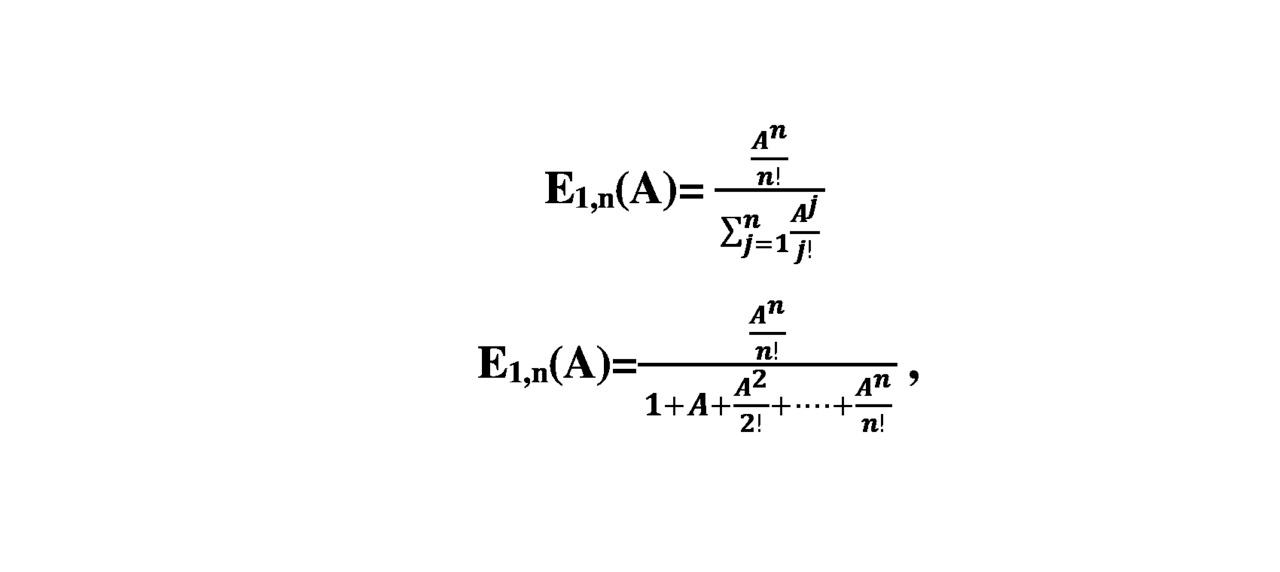
where A is the value proposal, expressed in relative units (see further explanations)
E1,n (A) — value of loss for the consumer system of n groups (the number one indicates that this is the first Erlang formula, then will the area of application of the second formula Erlang).
Chapter 3. Examples of application of the first formula of erlang for solving problems of the market
3.1. Define the initial data
3.1.1 Example 1. Determination of the intensity of consumption
Problem: Structural composition of consumers of products offered on the market is divided into 5 categories n1=50; n2=40; n3=30; n4=20; n5=10;
the average volume of one purchase (units) one consumer of each category during time of greatest demand (TGD). c1= 10; c2=10; c3=4; C4=3; c5=2; (not counted in the proportion of purchases with the return and other types of custom actions);
the average duration of consumption for consumers of different categories in days. T1= 2, T2=3; T3=5.; T4=10; T5=15;.
The maximum consumption of one consumer of goods 20 units per month.
To calculate the intensity of consumption goods coming on the market from the consumers of all categories in the THD.
Solution.
Determine the volume of goods that will be purchased in one month all categories of shoppers (the serviced goods Aserv (t1, t 2)).
=10 x2 +10x3+4x5 +3 x10 +2x15=130 units of goods.
Σ i=1 5 C’i
Consumption Rel. units equal to
A serv. =130/20=6.5 rel. units.
3.1. 2. Example 2. Determination of the intensity of the incoming proposals
The problem is formulated in the following way.
Given: the structural composition of suppliers (producers) of goods of the offered products on the market is subdivided into 5 categories n1=80; n2=60; n3=30; n4=20; n5=10;
— the average volume of one delivery (of items) from a single vendor in each category (in moments THD).
C1= 15; C2=12; C3=4; C4=3; C5=2;
— the average duration of consumption for groups consumers of different categories in days. T1= 3, T2=3; T3=4; T4=11; T5=15;.
The maximum consumption of one groups consumers goods 20 units per month.
Calculate:
— the intensity of the incoming supply of commodities on the market from the consumers of all categories in the THD.
The problem is solved as in example 1, but the result refers to the volume of incoming proposals.
It should be emphasized that to determine the value of proposals in relative units applied the maximum consumption by one consumer of commodity.
3.2. Example 3. The calculation the market of oil
In this section we show how to calculate the parameters of the oil market. Namely, will be calculated the relationship between supply and demand will be calculated losses. Oil is one of the global factors affecting the world economy.
Our example will show that demand depends on supply, that the overproduction of goods, increase the losses and the price ceases to be the engine of demand, and acquires a different function.
To select the source data, allowing to carry out calculation, we give the table of indicators taken from the Internet.
[4.2].
In table.3.1 shows the data for the production of oil and table.3.2 data for oil consumption in 2012.
Note that below we do not aim to obtain results for a particular case. The goal is to demonstrate the application of methods of Queuing theory to calculate the characteristics of the market.
Table 3.1.Oil production
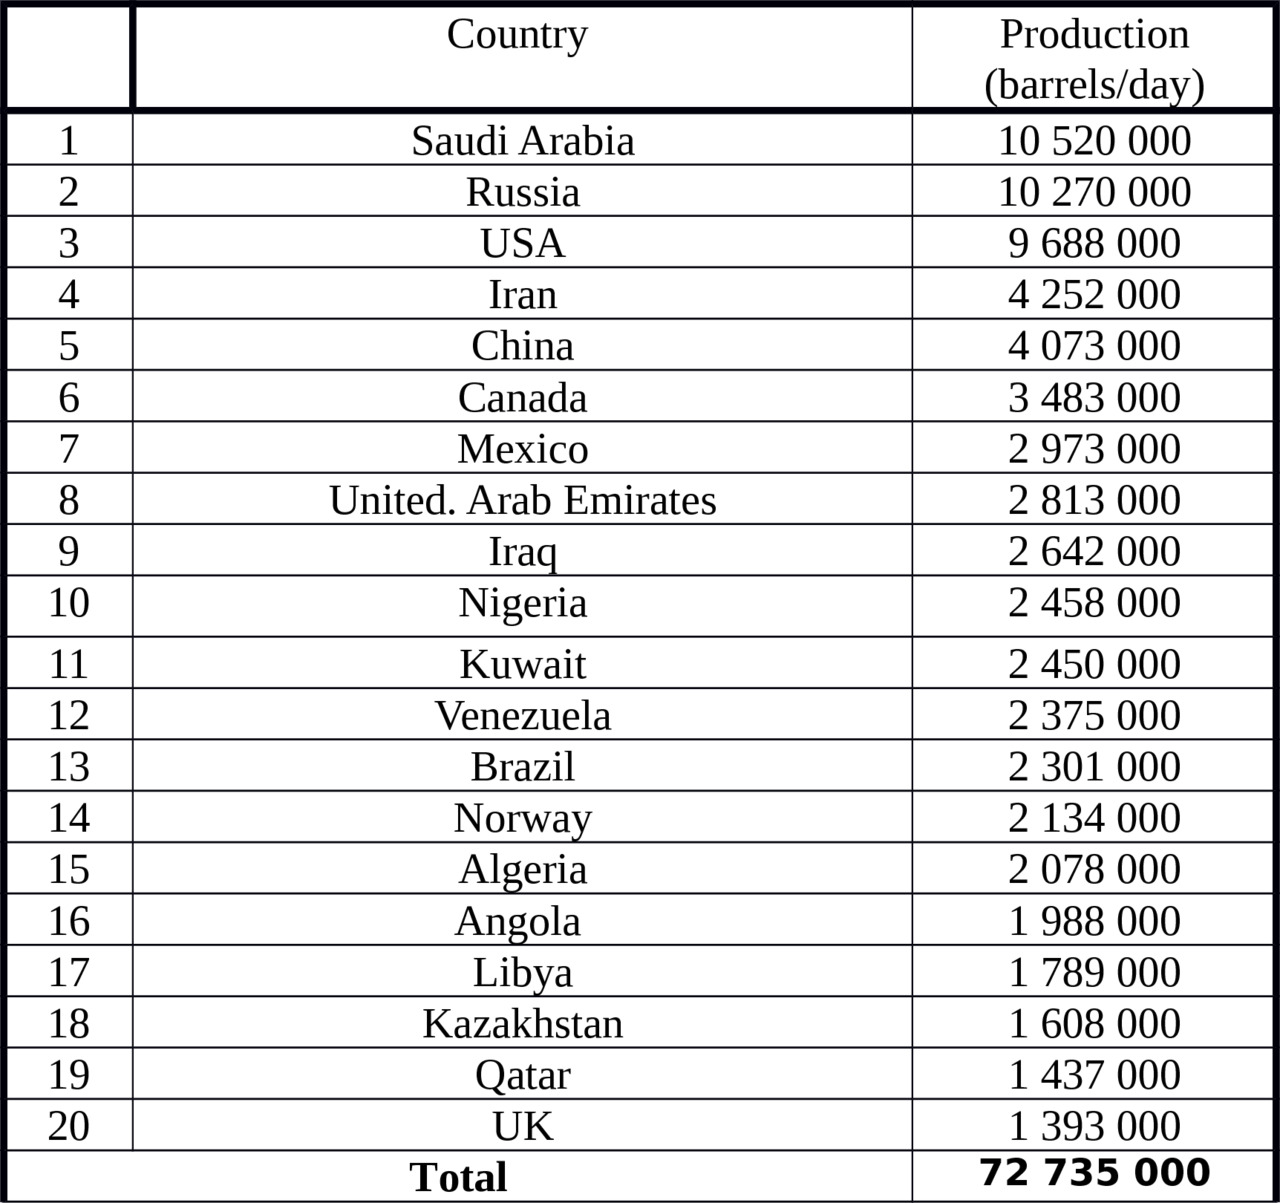
Table 3.2 Oil consumption
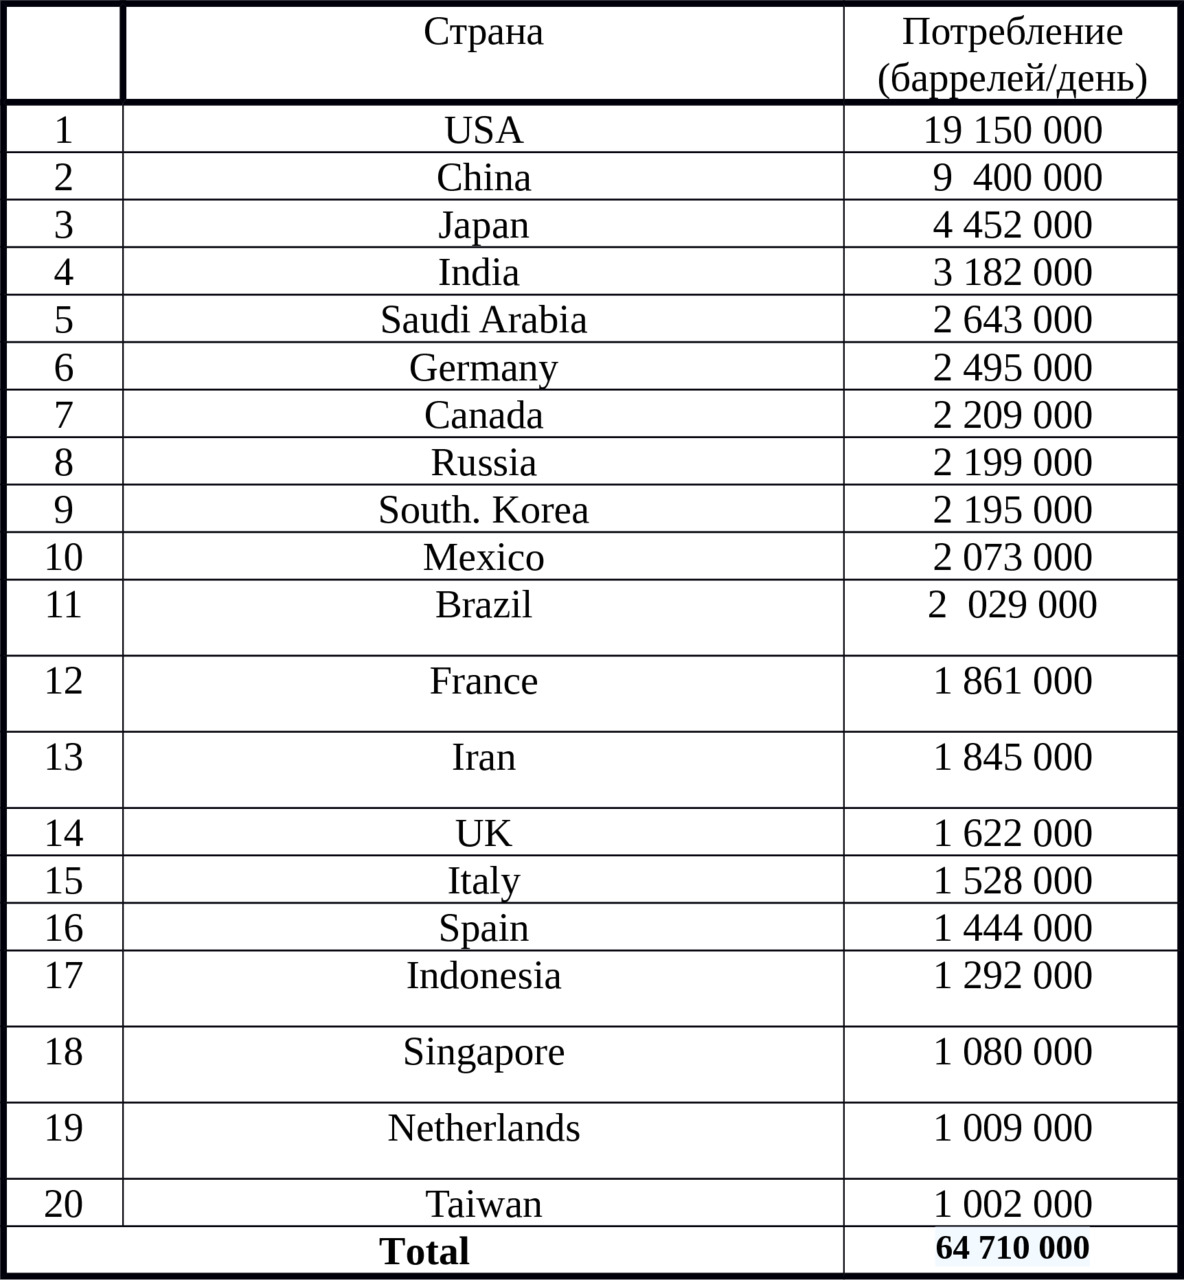
According to the table.3.2 average value of consumption of one group is equal to -3,235.5 million barrels a day.
To calculate relative consumption we will take
Pmax= 3 500 000 barrels/day
Let’s divide consumers into groups, each of which consumes Amax.
Note that one country can contain multiple groups of consumers. For example, Russia, can be represented as 45730 000: 3 500 000≈13 groups at the above-mentioned Amax value.
The results of the calculation when the supply of oil range from 7 million barrels/day to 140 thousand barrels/day is shown in table.3.3 and on the chart (Fig.3.1)
We will consider the simplest flow of supply of oil, system with full accessibility, with obvious losses (systems of service with the expectation we will consider in the following chapters,). These conditions allow us to apply the formula Erlang.
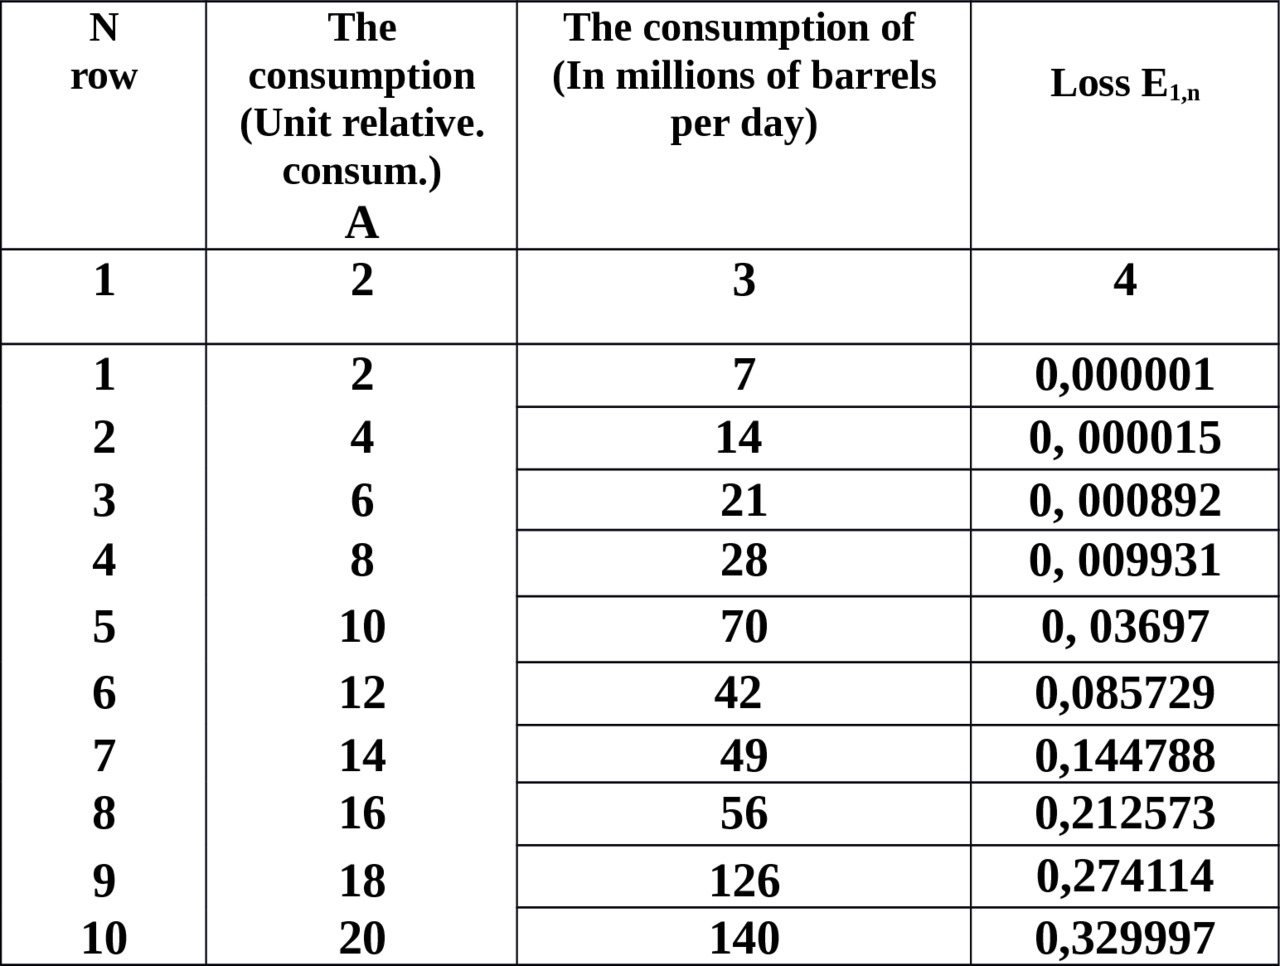
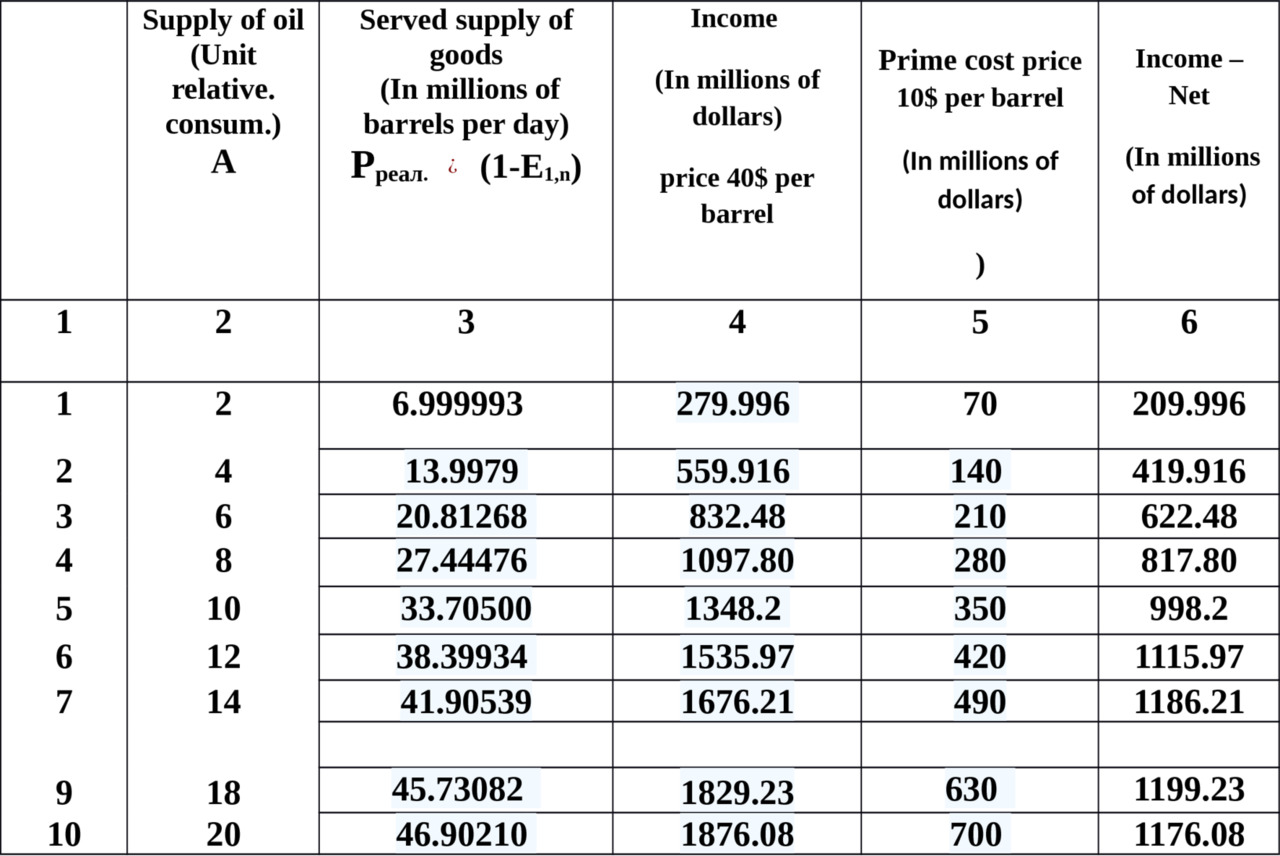
In table.3.4 in the column 2 shows the values of delivery in units of relative consumption in the range of 7 million barrels/day to 140 thousand barrels/day. In column 4, shown losses of E1,n. They are defined by the table of Erlang in accordance with the relative value of consumption (column 2) [Annex 1 of this book], [4.2].
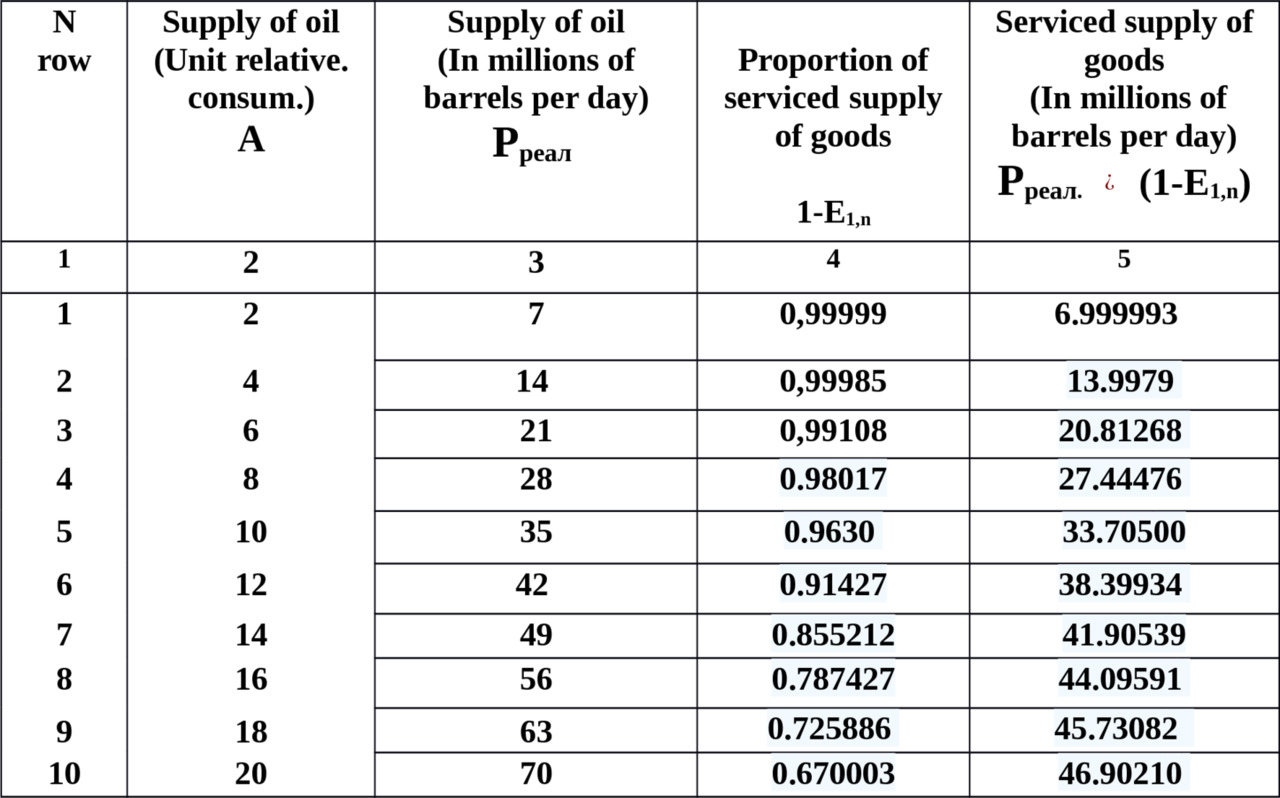
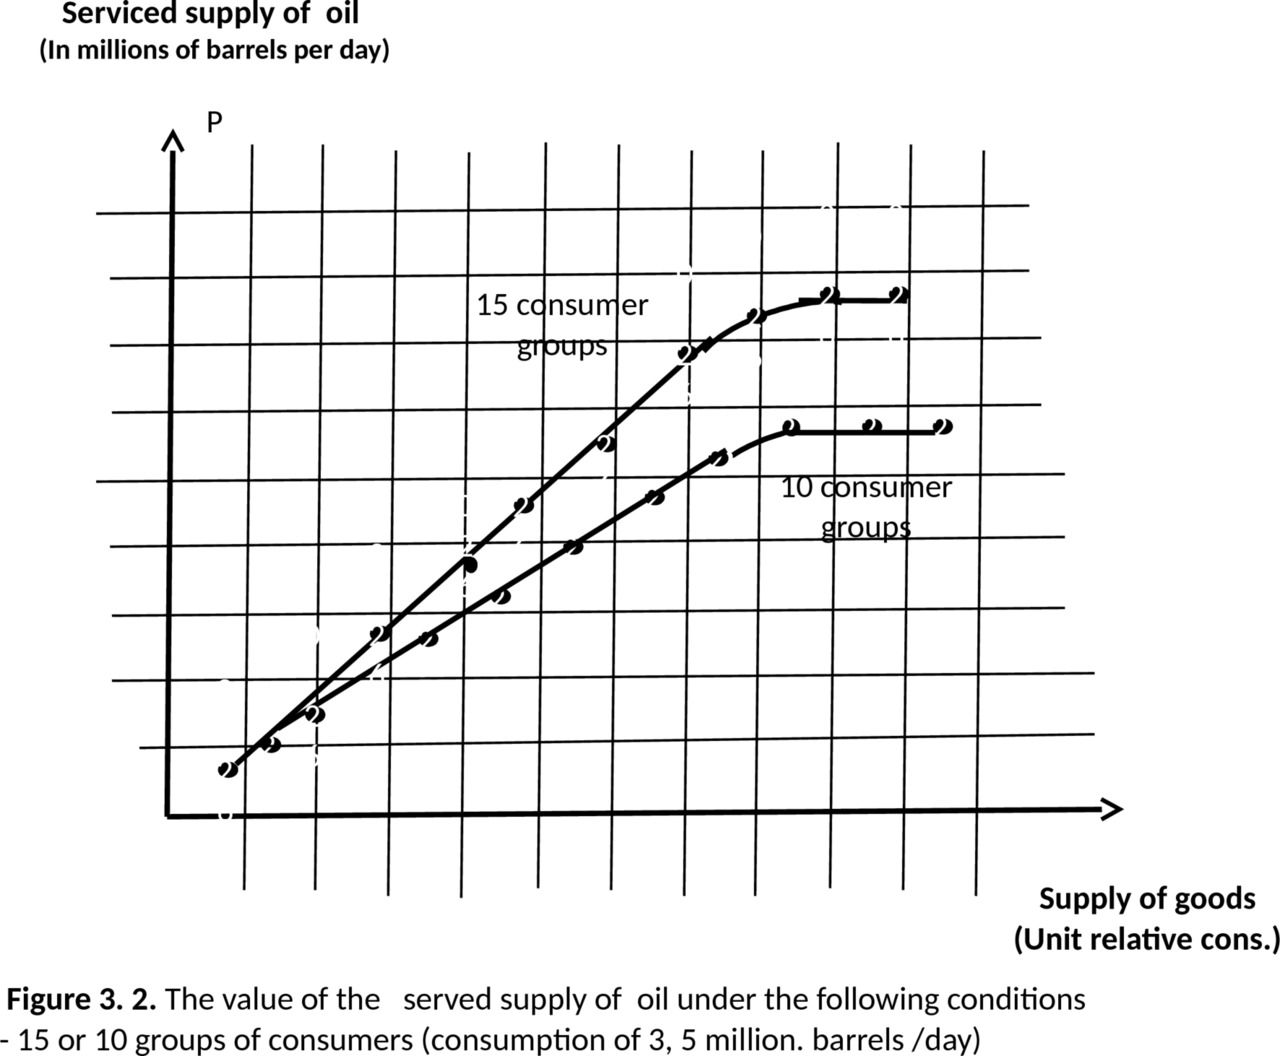
In table. 3.5 showed the results of the calculation of the serviced supply of goods of the oil market.
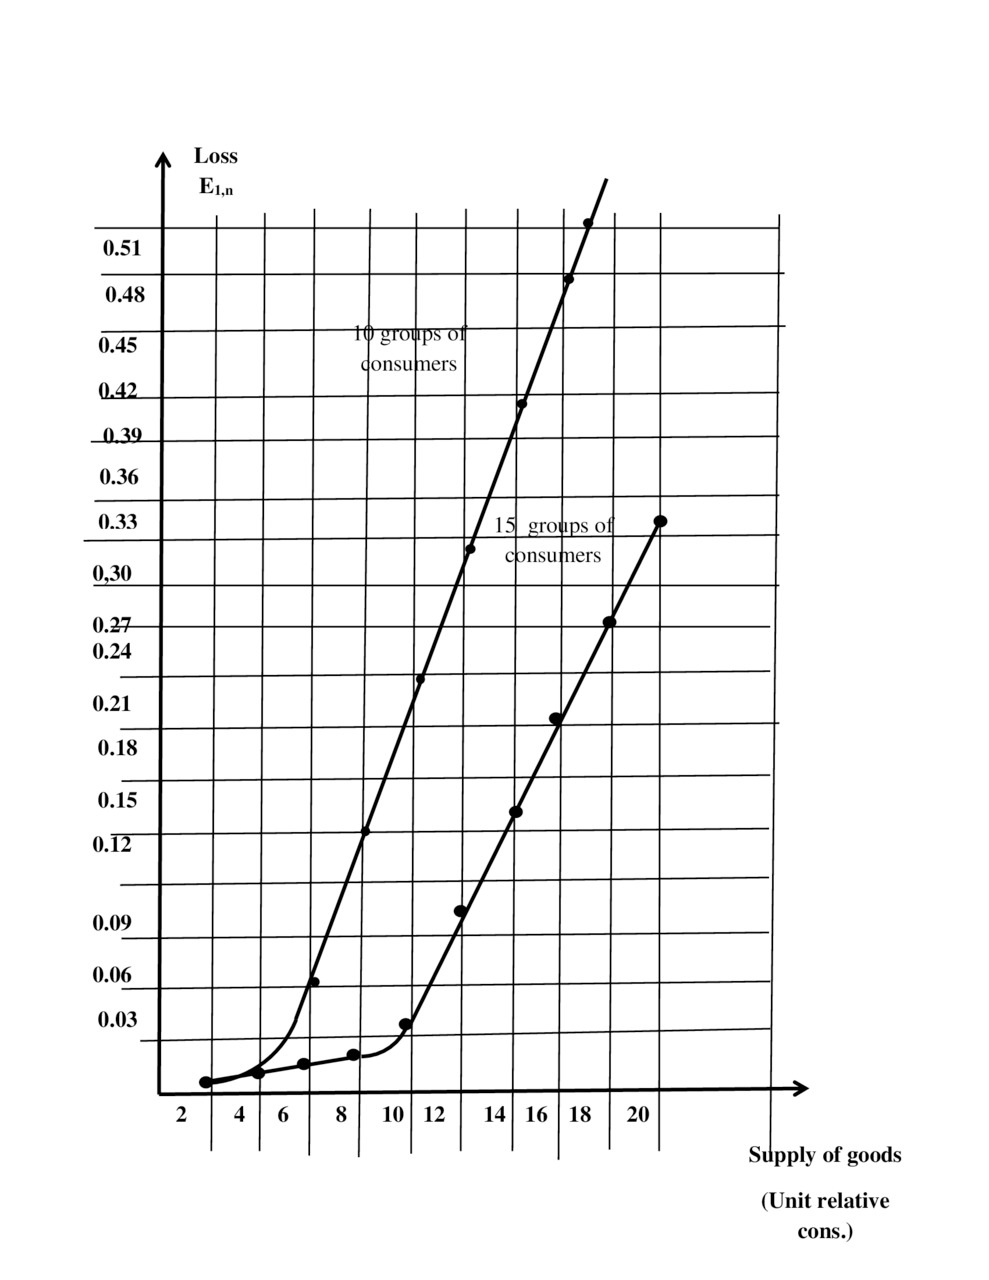
The corresponding curves for two different consumer groups is shown in Fig.3.2
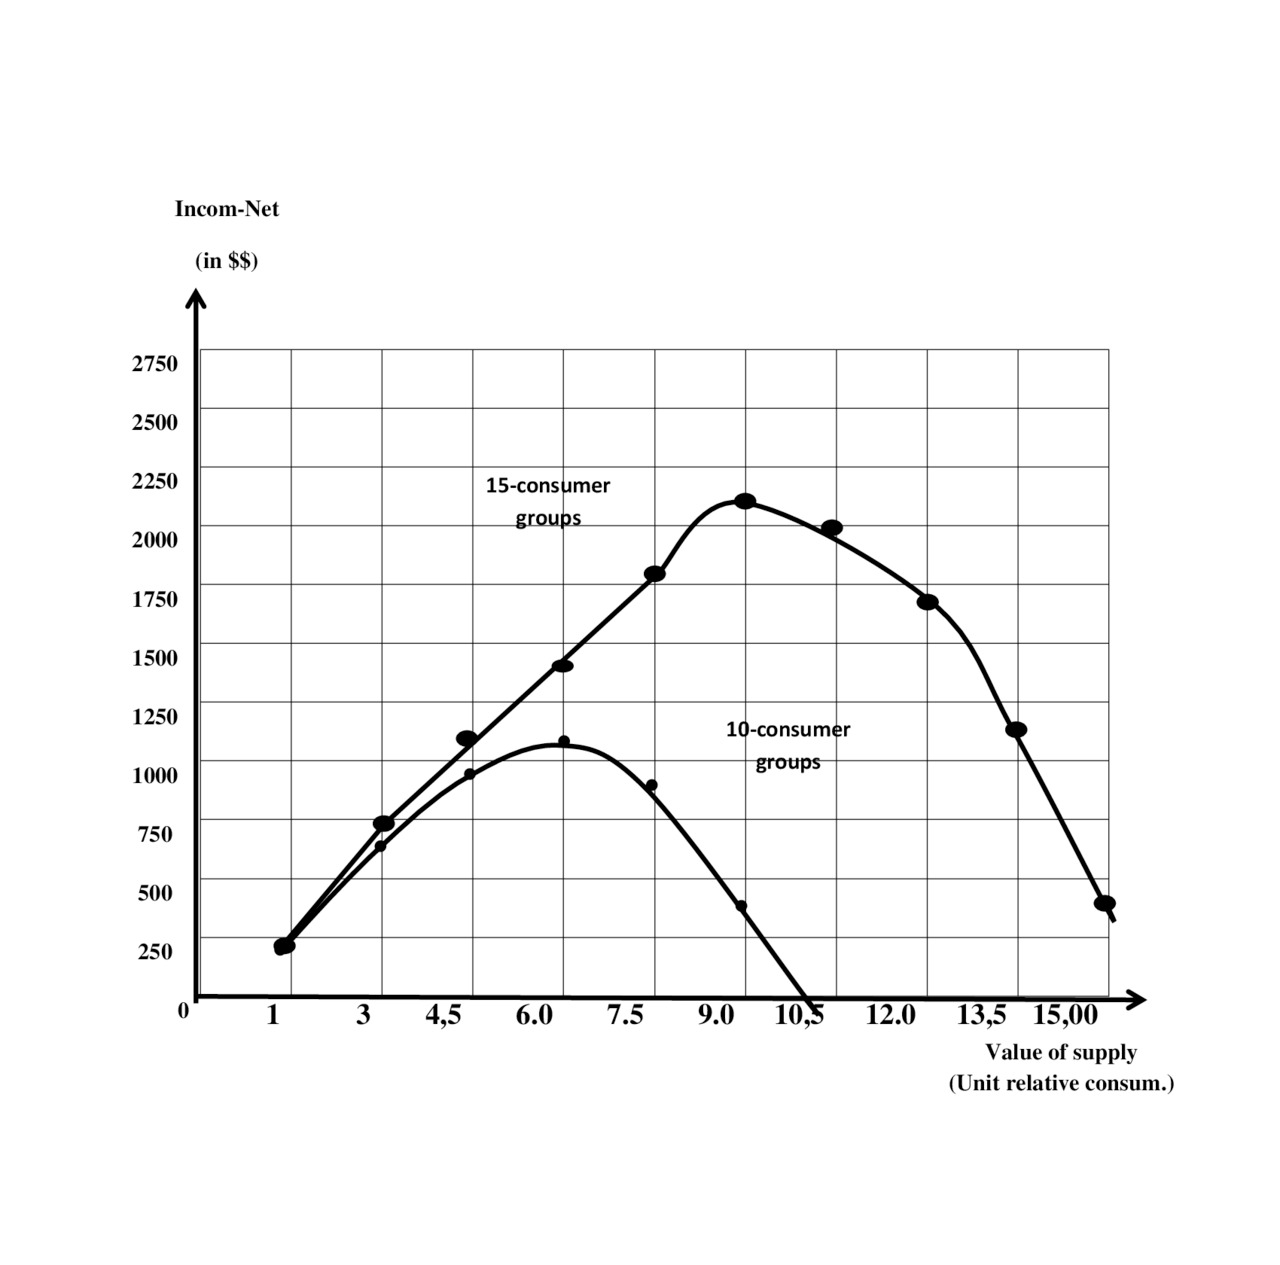
In table. 3.5 shows the results of calculation of income — net from served offers of the market of oil under the following conditions — 15 consumer groups
3, 5 million. barrels /day. It is assumed that the cost of the delivered goods proportional to its size (in the General case, there may be other options — the exponential increase, decrease the cost by increasing supply, etc.)
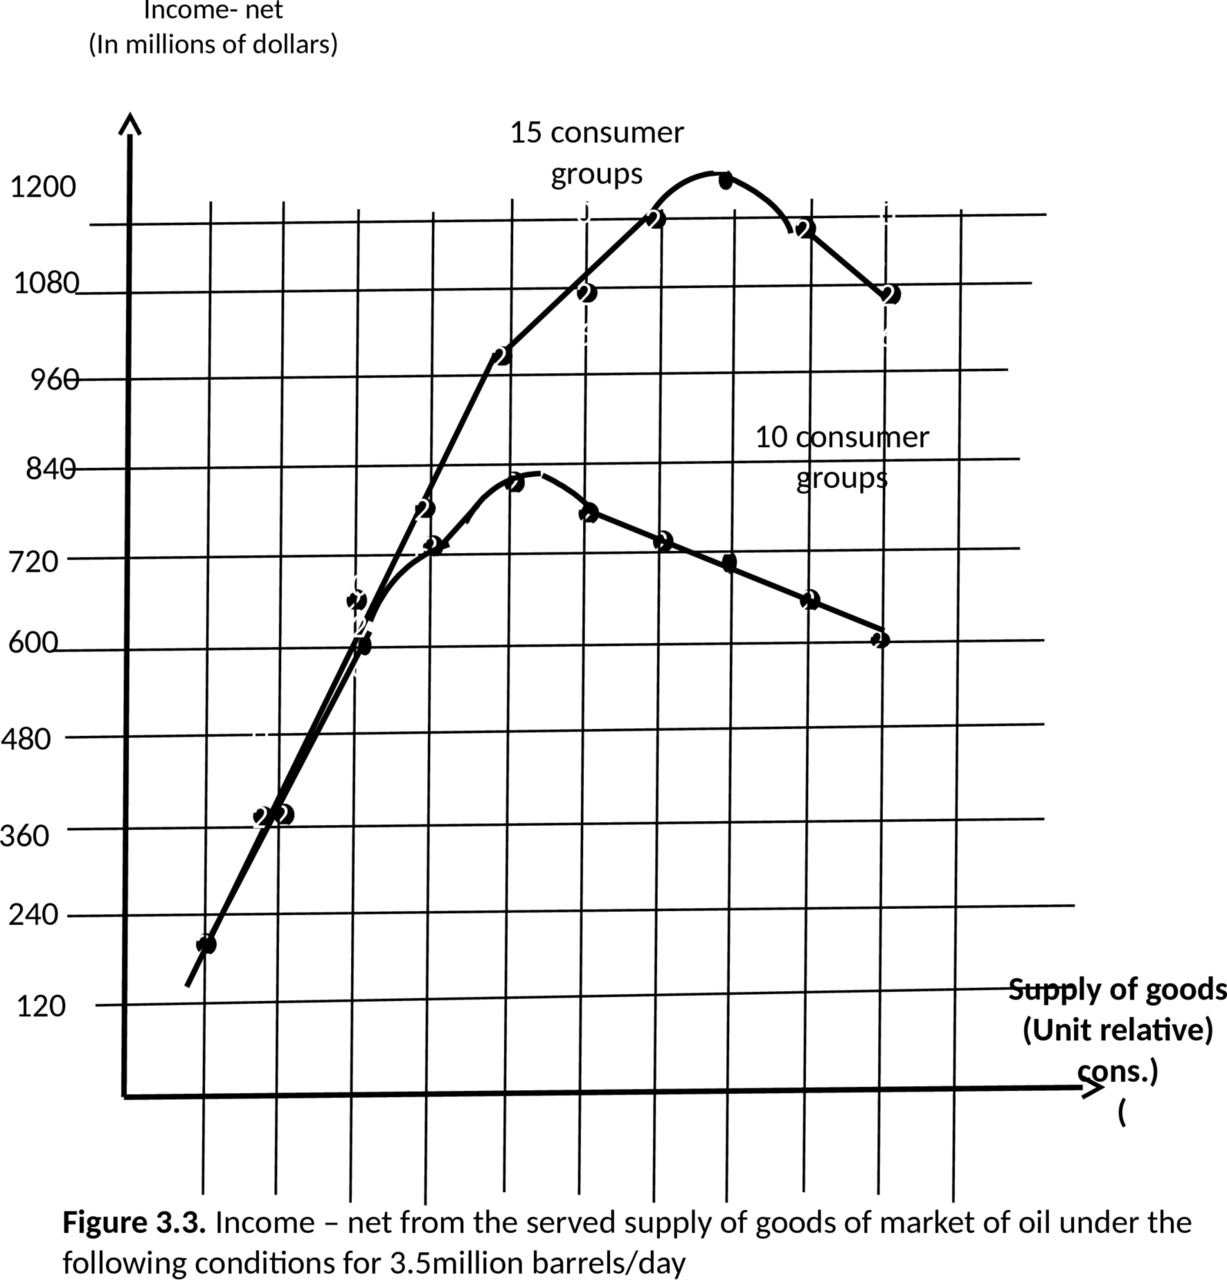
The figure.3.3 is a graph that takes into account the incomes for groups of 15 and 10 consumers.
The decrease in the number of consumer groups or, what is equivalent to this event-the decrease of consumption is observed at the higher prices.
Analyzing these figures one can notice that at decreasing the number of groups of consumption occurs:
— increased loss (see Fig.3.1.);
— saturation of the market at decreasing the number of group occurs later, but at a lesser quantity handled supply of goods (see Fig.3.2);
— Income — net is reduced (Fig.3.3).It is necessary to note one more feature that in the regime of saturation the increase in the supply without increasing the total relative consumption increases losses. Recall that the total relative increase in consumption can be achieved by either an increase in real consumption (Areal.), either by increasing the number of consumers.
But at time of the saturation of the market, the increase in one or the increase of both indicators in most cases difficult.
A price reduction may be used only for competitive fight (the increase in the number of consumers at the expense of other market participants)
Also based on this chart, you can consider the effect of the appearance on the market of new products (scope of supply) without increasing the number of consumers in the market. For example, the supply of Iran after his a long absence in the market will lead to an increase in the loss or redistribution of consumers.
In the following example we consider one of possible problems in the study of the properties of the market.
3.3. Example 4. The influence of the size of the group of consumers to a change in the AMOUNT of the proposal
In the previous section we looked at the market as a whole. In this example, we consider the individual markets (while not affecting the competition). Examine the question of the reaction of the markets of various sizes on the change supply.
Let’s take a look at three separately functioning market, which have a different number of consumer groups:
n1 =20, n 2 =40 и n 3 =60.
These markets cater to the simplest flows of goods. Consider different values of flows of goods in weekend and weekdays.
The first market, consisting of n1 =20 consumer groups, receives the supply
A1A =12, 4 rel. unit (weekend);
A1B =11, 1 rel. unit (weekday).
The second market consists of n2 =40 consumer groups, receives the offer amount
А2A =30,0 rel. unit (weekend);
A2B =27.5 1 rel. unit (weekday. y)
The third market is composed of n3 =60 consumer groups, receives the amount offer
А3A =49,0 rel. unit (weekend);
А3B =45,0 rel. unit (weekday).
Need determine
— losses in the number of requests received for supply of goods —
p request,
— the losses in volume of the goods — p goods.,,
— the losses the time of implementation –pt.
— in the group n 1, n 2 and n3, correlation between relative change values of losses and supply of goods in each of these groups.
Solution
In tables of first Erlang formula we will found:
(p request = p goods = pt =E n (A)).:
E n1 (A1A) =E 20 (11,1) =0,0050; E n1 (A1B) =E 20 (12,4) =0,0127;
E n2 (A2A) =E 40 (27,5) =0,0053; E n2 (A 2B) =E 40 (30,0) =0,0144;
E n3 (A3A) =E 60 (45,0) =0,0054; Е n3 (A3B) =E 60 (49,0) =0,0172.
— The relative value of change losses δlosses and change supply δsupply. are determined from ratios:
δlosses = (E n (Aa) — En (Ab) / En (Ab)) x 100%
δsupply. = ((Aa — Ab) / Ab) x100%
If n1 =20
δlosses = (E n (12.4) — E n (11.1) / E n (11.1)) x 100% = 154%
δsupply.. = ((AB — AA) / Ab) x100%= ((12.4 — 11.1) /11.4) x 100%= 11.7%
Similarly we define:
if n2 =40 δlosses 2 =172%, δsupply 2 =9,1%
if n3 =60 δlosses 3 =219%, δsupply 3 = 8,9%.
The relation between δlosses and δsupply.1 for groups n1, n2 and n3 represent respectively:
δlosses 1 / δsupply.1 =13.2;
δlosses 2 / δsupply 2 =18.9;
δlosses ь3 / δsupply3 =24. 6
It should be emphasized that for given values of supply, increase by approximately 10% (11.1%, 9.1%, 8,9%) and It leads to increased losses in 2,5–3 times, i.e. the losses increase by 10—25 times faster in comparison with the value of incoming supply.
3.4. Example 5. Separation market of consumption in case of overload
Consider a market in which there is danger of overproduction. In this case, may be provide for the reserve market that can take on the goods what not sale..
For example, for the oil market can be envisaged in addition to the market of goods of energy (gasoline, diesel fuel, etc.) market of synthesis polymers (plastics, synthetic resins, artificial fibers, etc.). This is goods what make from oil. Consider the separation of market.
Suppose we have a market with 16 groups of consumers to which do an supply A1 =10 rel. units
We organize two markets (primary market and reserve market) for 8 groups of consumers.
Let’s determine the value of losses of initial market, the value of losses of divided the market.
Solution
1. Applying the formula of Erlang, get the losses probability E1=0, 0223 or of 2.23%.
2. Lost good is equal to A2=10×0,223 = 2.23 rel. units
Now consider the market which divided into 2 parts (8 consumers each).
Need determine next
— losses of initial market;
— quantity of losses the divided market.
Solution
— Applying the formula of Erlang, we get the losses probability
E1=0, 0223 or 2.23%.
— The quantity of supply transmitted to the backup market is
10×0, 0,33 82 =3,3 82 rel. units
— Losses reserve market will be E3=0, 0019 or 0, 19%
— Losses supply of goods will be equal to
A3=3.382×0,0019=0,00642
On the market, which divided, losses will be 0.19 percent, which is less than 2.23 percent.
Note.
This result is approximate. When more accurate calculations we must consider that:
— Lost the flow may not be the simplest.
— Goods of reserve market, shown here in relative units is calculated in relative units other values than goods of the primary market.
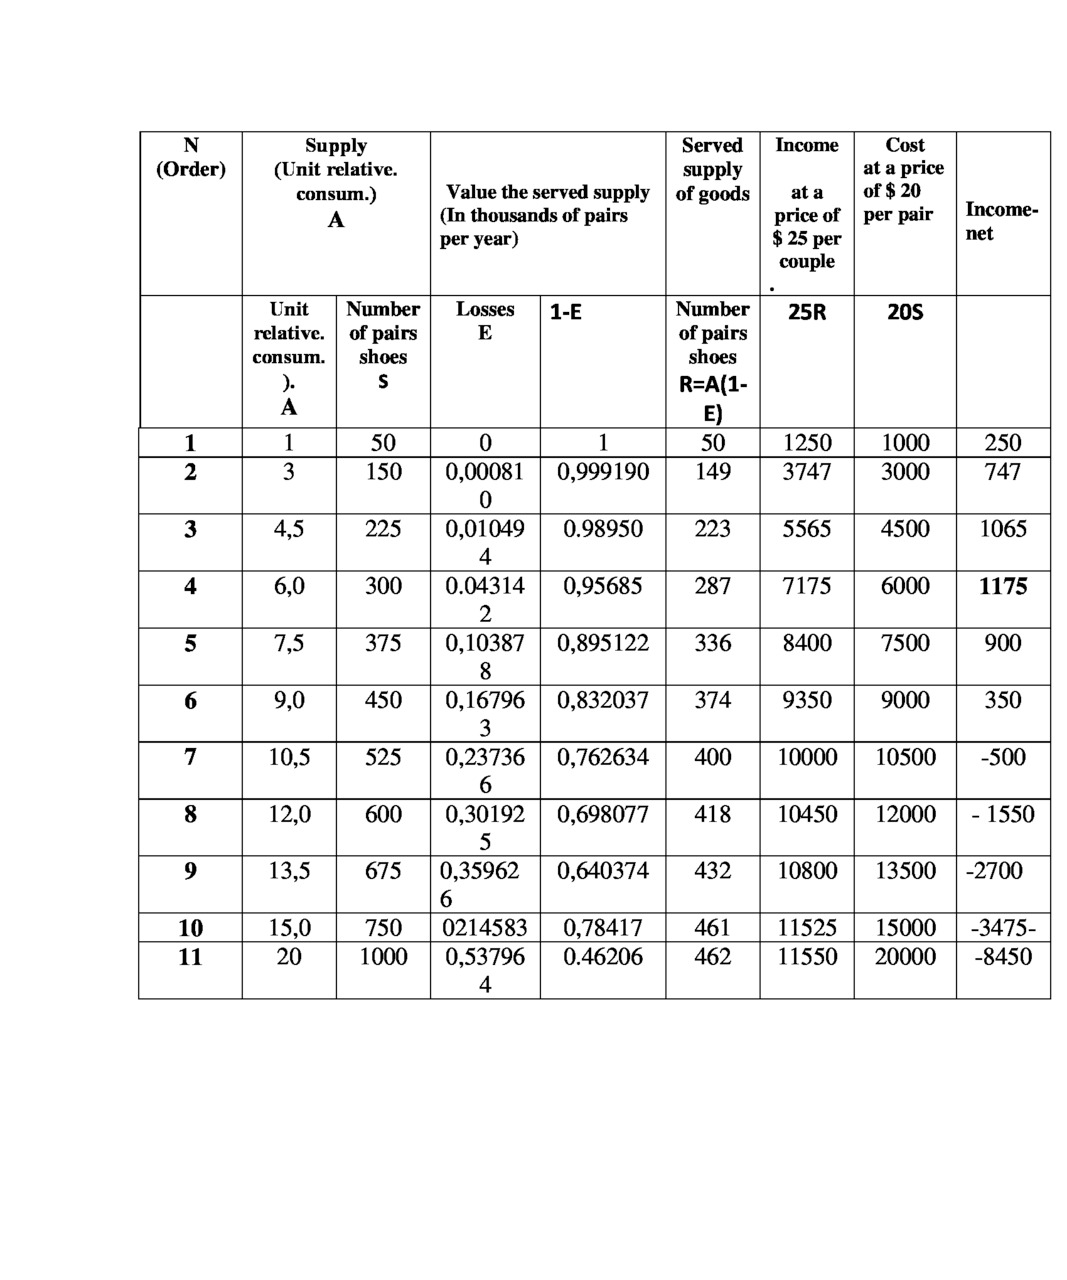
3.5. Example 6. Calculation the volume of sales of women’s shoes
Let there is a region or a city where there are several centers for women’s shoes.
We consider two variants in this market. Source data taken from the Internet [4.5] But again it should be emphasized that for us are important, not the result of calculation, we want only to illustrate the method of calculation.
The first market has 15 stores (consumers).
The second contains 10 outlets (consumers).
Maximum selling 50 pairs a day.
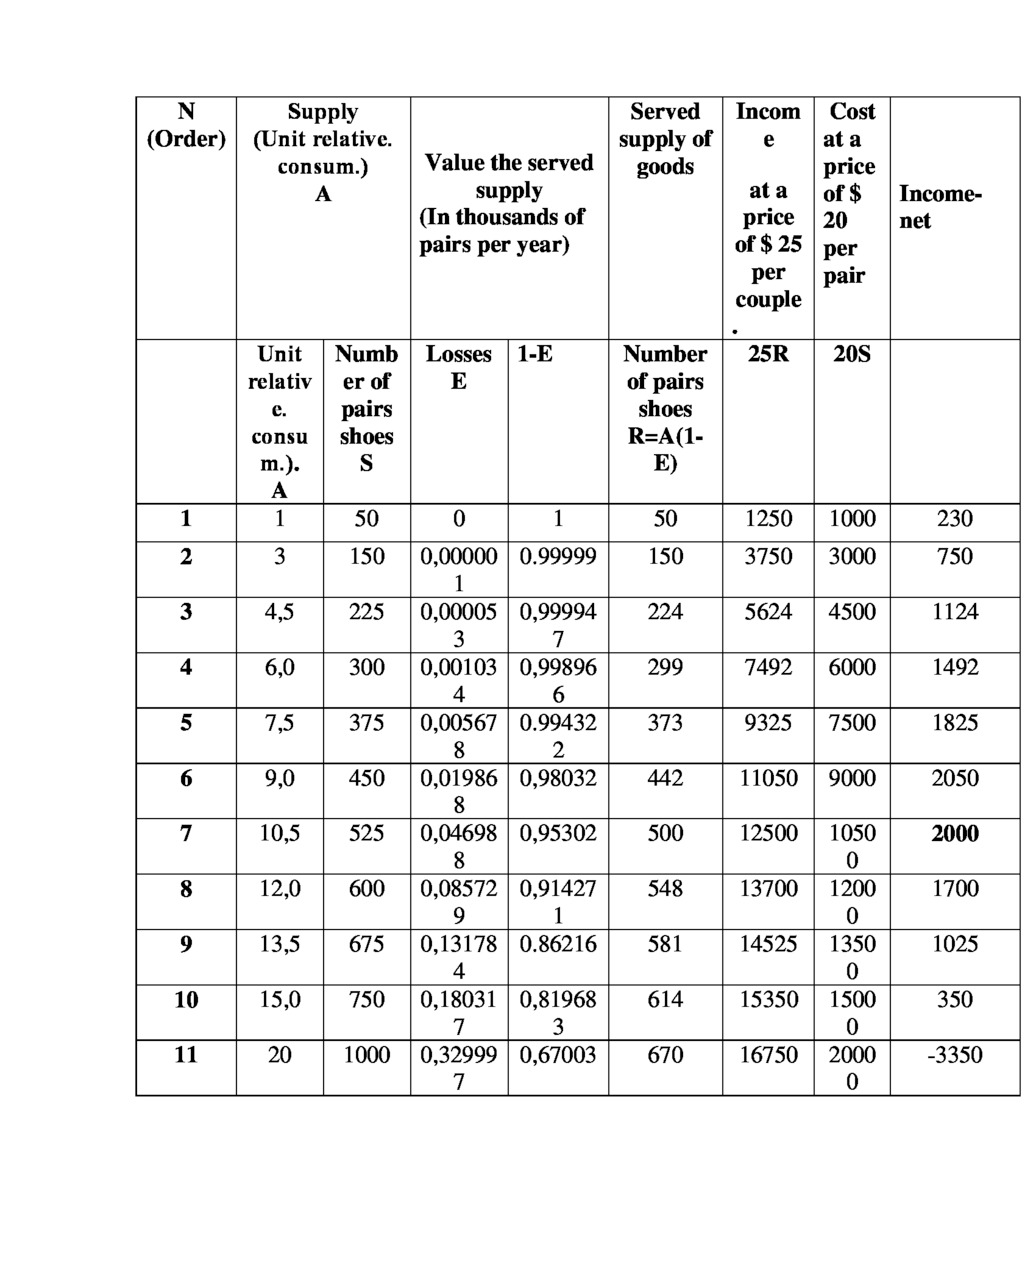
The results of the calculations are shown in table.3.6 and 3.7. and presented on the curves of –Fig.3.4.They show the point of crisis. These points are equal
:For the market with 15 groups of consumers, when delivering 500 pairs of (income –net 2000 $ per day)
For the market from 10 consumer groups — in the delivery of 287 pairs of (income — net 1176 $ per day)
Since the demand for different types of shoes depends on the season, consider this problem.
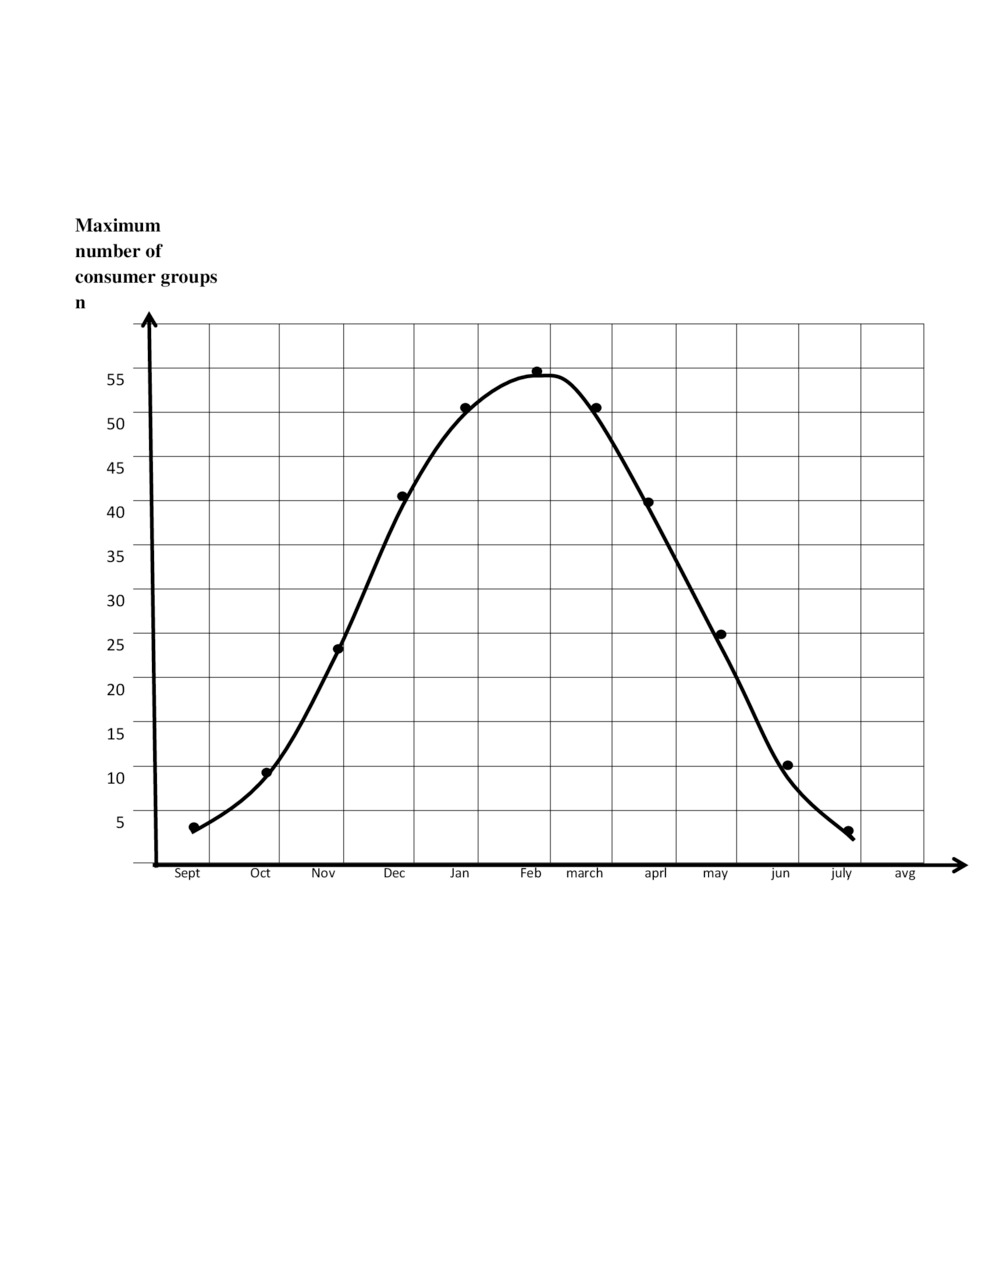
3.7.Example 7. The distribution of the number of groups of consumption in time (e.g., seasonal)
Consider the goods demand, which varies depending on month of the year, as shown in Fig.3.5.
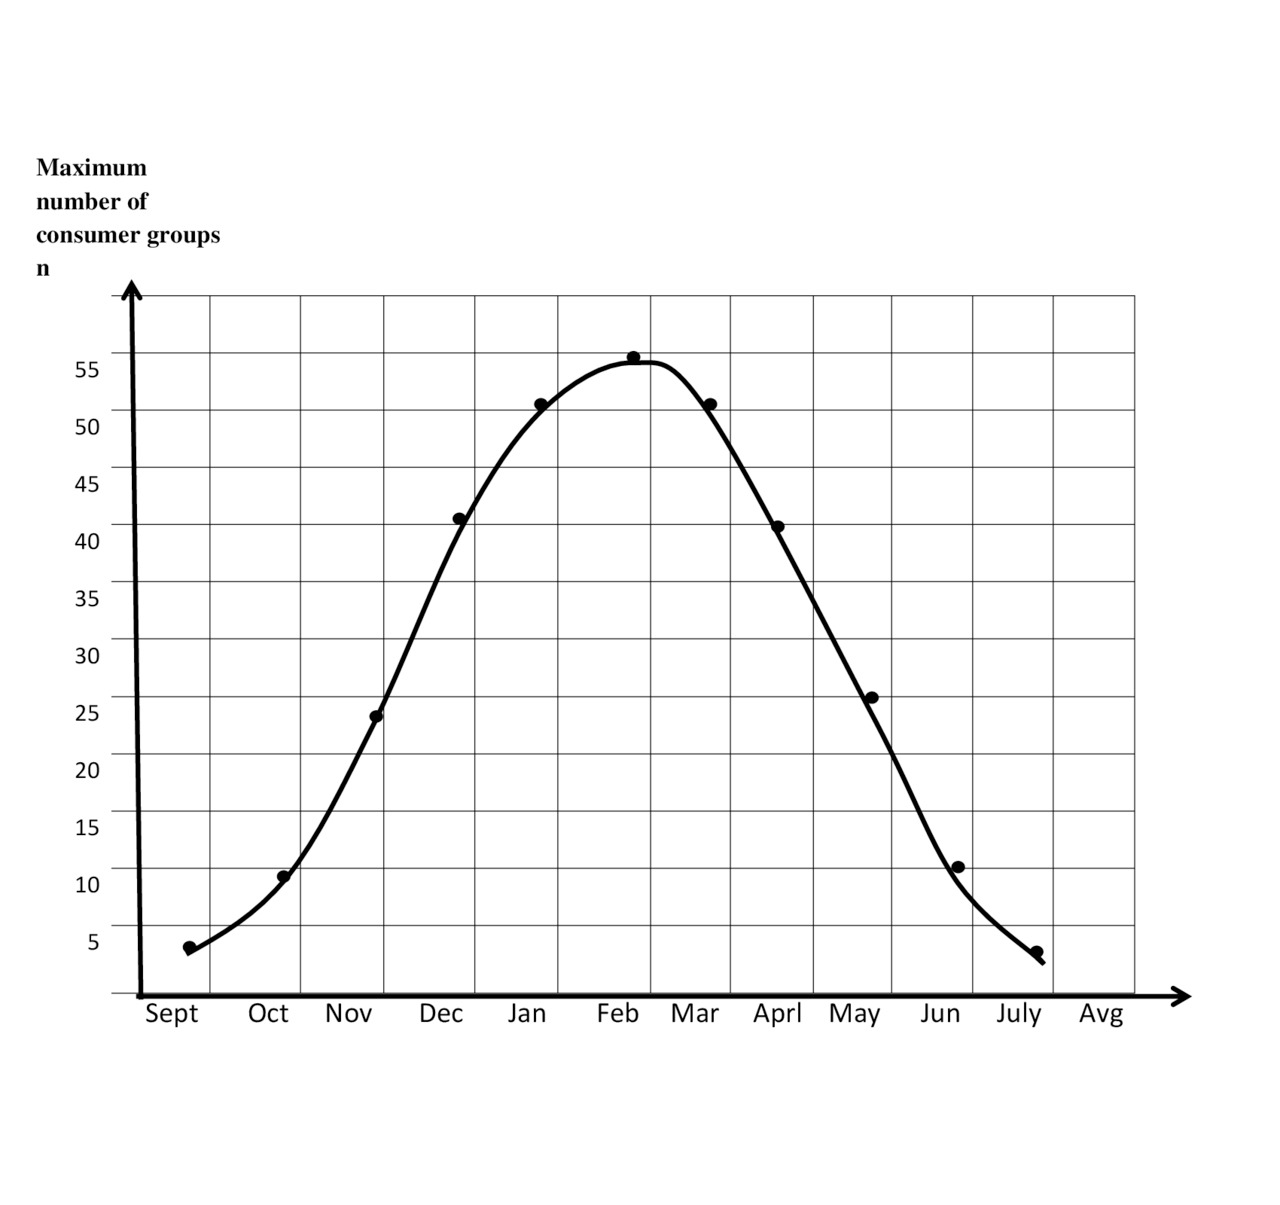
The figure resembles the probability density function of the normal distribution, although different parameters of the curve [1.1—1.3].
The increase in consumption the figure shows as the increase of number of consumer groups.
This is because, definition — the maximum intake is standardized as a constant. An increase in the relative consumption may not exceed a maximum value
(A=Preal/Pmax =1).
Therefore, consumption growth may be reflected by the increase in the number of groups of consumption.
It is required to determine: How will the change in relative consumption (A) if you want to save the value of the losses p=0.06.
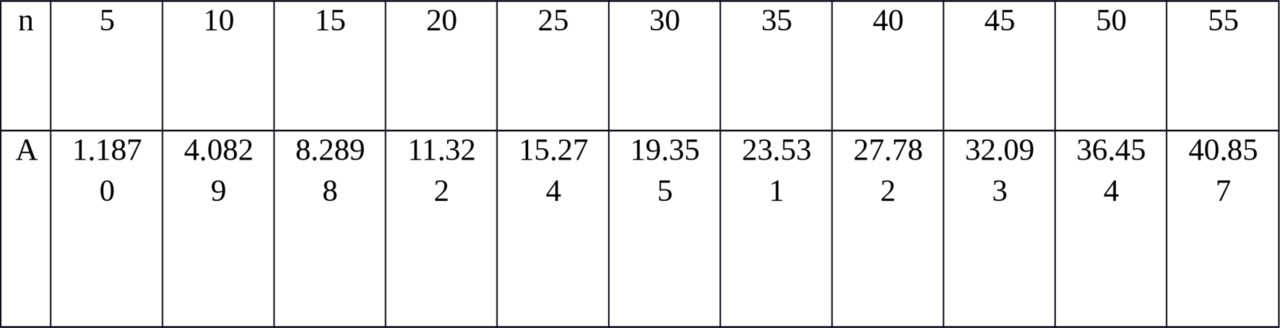
Using Erlang table, we obtain the following table (table.3.8)
Losses P=0.06
You can then calculate the maximum income — net, for each month, as it was shown in the previous examples.
3.8. Example 8. Change the number of groups of consumption to save the value of losses
Goods are received from the three groups of suppliers. They forming the elementary streams and creates a flows of sentences, the intensity of which are a 1=10,
a 2 =20 and a3 =40 rel. units. These flows of goods are is served full accessibility groups of consumers.
To determine
— the required number groups consumption, if the losses should not exceed
En (A) 1 ≤0,005 and E υ (A) 2 ≤0,02;
the ratio between the relative values of the increment of the number of groups of consumers and the possibilities of increasing the intensity of the incoming load while maintaining a specified quality of service.
Solution:
— We use tables of Erlang formulae for the given values of the intensity of the incoming proposals and the preset loss values of E n (A) determines the required capacity of the consumer groups :
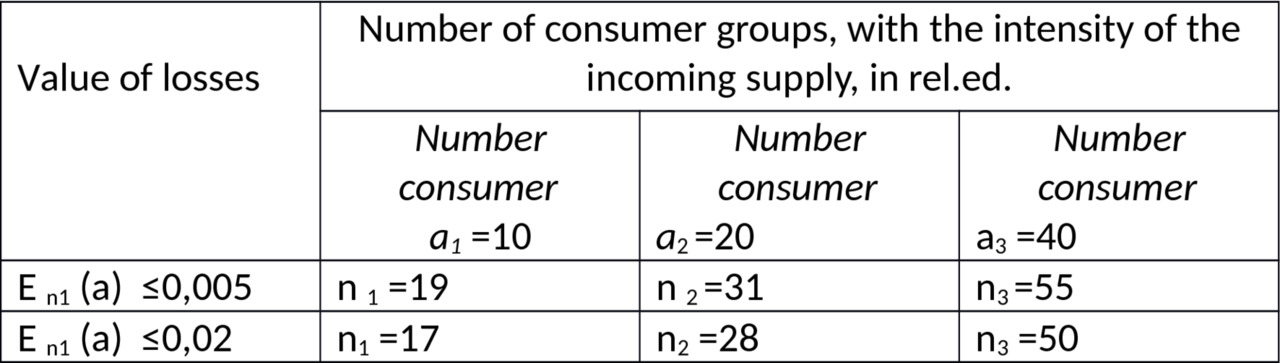
— the relative size of the increment in the number of consumer groups δυ and increase the intensity of the incoming proposals δsupp. are determined from the ratios: consumer groups, with the intensity of the incoming sentence, in rel. ed.
If Е n (a) 1 ≤0,005 δn1= (n2 — n1) /n1) x100% = (31—19) /19) x100% = 63.15%;
δυ1= (n3 — n2) /n2x100% = (55—31) /31x100% = 77.4%;
If Е n (a) 2 ≤0,002 δn1= (n2 — n1) /n1x100% = (28—17) /17) x100% = 64.7%;
δn1= (n3 — n2) /n2x100% = (50—28) /28) x100% = 78.6%
The solution to this problem shows the conservation of a predetermined value of losses:
— if to full accessibility group arriving flow with the intensity a=10÷40 rel. ed., the increase losses with E n1 (a) ≤0.005 to-E n2 (a) 2 ≤0,02 (4 times) allows to reduce the required quantity of groups of consumers only about 10%; (n 1 =19 and n1 =17, N2 =31 and n2 =28 and n3 =55 and n3 =50).
— in the region of small losses and increasing supply (a=10÷40 Rel. ed) required capacity of consumer groups is increasing slower than the size of supplies received. For a fixed value of losses increase in the intensity of the incoming load is 2 times requires increasing the capacity of consumer groups to 65—80%.
If E n1 (a) ≤0,005 volume of groups of consumers (n1) is changing
19, 31, 55.
When E n1 (a) ≤0, 02 volume of groups of consumers (n1) is changing 17, 28, 50.
3.9. Example 9. Change of the number of groups’ consumption the result of competition
Consider a market of m groups of consumers who came to the agreement on the supply of goods to the market.
This agreement is determined by the number of consumers of this product on the market and consumption value.
For example, to minimize the loss of OPEC and other countries signed an agreement that they provide the maximum possible in this situation, the net income for all market participants. It is clear that each receives income in accordance with its level.
Consider the consequences of violation of this agreement. Note that this that this violation occurs in conditions of overproduction. This means that the amount of consumable production from individual consumer stabilizirue (user mode saturation and relative consumption close to 1). And the number of consumers is also stable (covered all the possible sales areas).
In these circumstances one of the parties reduces the cost and thus attracts more number of consumers to buy their products (x). The number of consumers of the firm increases and the number of consumers of other firms decreased by the number of m.
Let’s see how can is increase the income of the firm and how income will fall by other manufacturers.
Consider the oil market with the indicators given in example 3. Currently, countries have agreed to reduce oil production at a certain level.
According to our calculations, the maximum income for all countries is achieved when the indicator 14 units (15 consumers) or 44 million barrels per day, with 20 producing countries (2, 3 million barrels per day).
At present, oil production by OPEC countries and other 11 countries consistent 1.7—1.8 million barrels per day (36 million barrels per day).
Calculation of performance
Бесплатный фрагмент закончился.
Купите книгу, чтобы продолжить чтение.