
Бесплатный фрагмент - Труды Евразийского общества генетической генеалогии
При импорте мы не смогли распознать 6 неведомых объектов (скорее всего изображений). Пожалуйста, проверьте Вашу книгу, все ли изображения (или другие объекты) на месте. В противном случае попробуйте сохранить объекты как изображения и затем вставить их с помощью инструмента «Вставить изображение» в верхней панели инструментов
Кажется, в вашей книге есть формулы. Мы вставили их в макет, но наши заботливые роботы иногда ошибаются при этой операции. Пожалуйста, проверьте, как ваши формулы выглядят в готовом макете. Если вы заметили в формулах ошибки, попробуйте создать новую книгу в Ridero и загрузить Вашу книгу через Google Docs.
The European Relatives of the Yakuts
by Dmitry Adamov
Abstract
Family Tree DNA’s Big Y test revealed that two men of European origin have the same SNP substitutions in the Y-chromosome as the Yakuts from the North-Eastern Siberia. The Time to the Most Recent Common Ancestor is estimated as 3100 years before the present, 95% CI: 2300—3900 years.
Introduction
The Yakut are an indigenous population of the Sakha (Yakutia) Republic, Russia. According to Lippold et al. (2014), and Adamov (2014) about 90% of Yakut men have an M2019 base substitution in their Y-chromosomes. The M2019 mutation constitutes separate branch within haplogroup N-L839/L708.
The great majority of European N-L839/L708 samples belongs to the N-L1026/L392 branch, which is parallel to the N-M2019 branch. Branches N-M2019 and N-L1026/L392 separated about 6000 years BP (YFull Experimental YTree, 2015).
Materials and methods
Big Y is a commercial test offered by Family Tree DNA (Big Y White Paper, 2014). Big Y allows genotyping of between 11 and 13 million nucleotide base pairs with confidence.
According to the Big Y test, two FTDNA project participants have the M2019 mutation. Both are of European origin and their paternal lines appear to be the same as the Yakut’s. The European samples will be referred to as Eur1 and Eur2.
Fortunately, there is one Yakut Big Y sample. The Yakut sample will be referred to as Yakut.
BAM and VCF files were used to determine Single Nucleotide Polymorphisms (SNPs) and some Y-STRs.
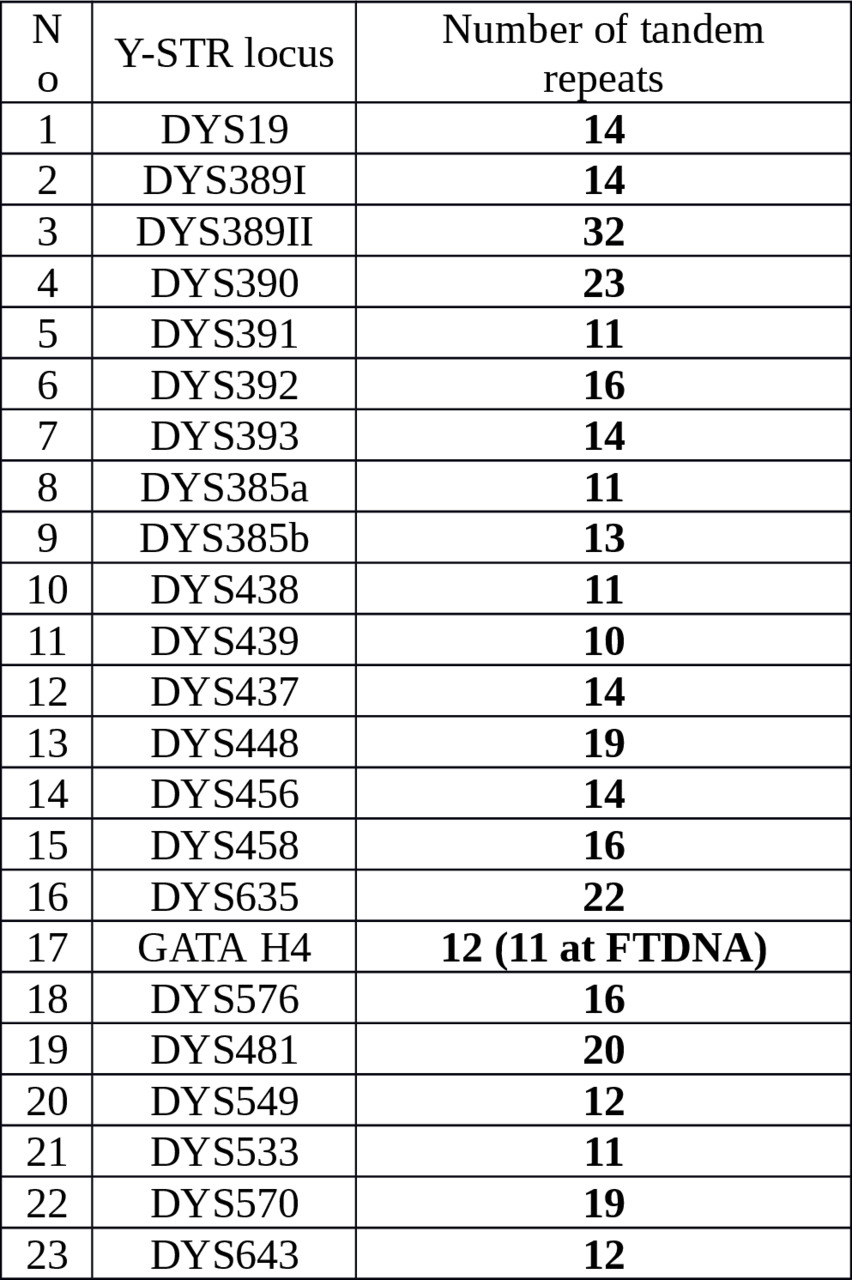
Y-STR haplotypes that we presumed had the M2019 mutation were collected from FTDNA projects and scientific papers. Sample selection was focused on the Yakut modal haplotype evaluated from Karmin et al. (2015) and Gao et al. (2015), see Table 1.
Table 1. The Yakut Y-STR modal haplotype
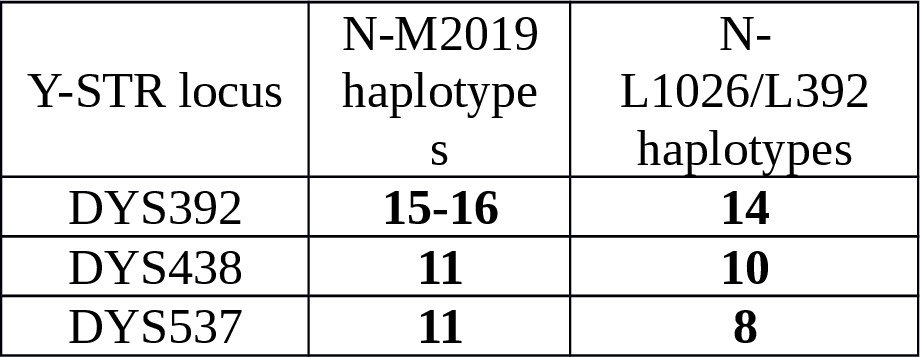
Main differences between M2019 and L1026/L392 STR haplotypes were also used at selection process, see Table 2.
Table 2. Main differences between M2019 and L1026/L392 Y-STR haplotypes.
Selected Y-STR haplotypes which are presumed to have the M2019 mutation are presented in Table 4 and Supplementary Table S2.
The Time to the Most Recent Common Ancestor (TMRCA) was estimated on SNP counts in the Big Y results. The method was described in Adamov et al. (2015). We used a constant of SNP mutation rate per base per year (Adamov et al., 2015).

The additional method of estimating the TMRCA employed Y-STR polymorphism. A version of the interclade ASD method was described in Adamov and Karzhavin (2011). The Y-STR mean mutation rate was taken as 0.00258 per locus per generation. We used the mean generation interval 31.5 years according to Fenner (2005).
Results and Discussion
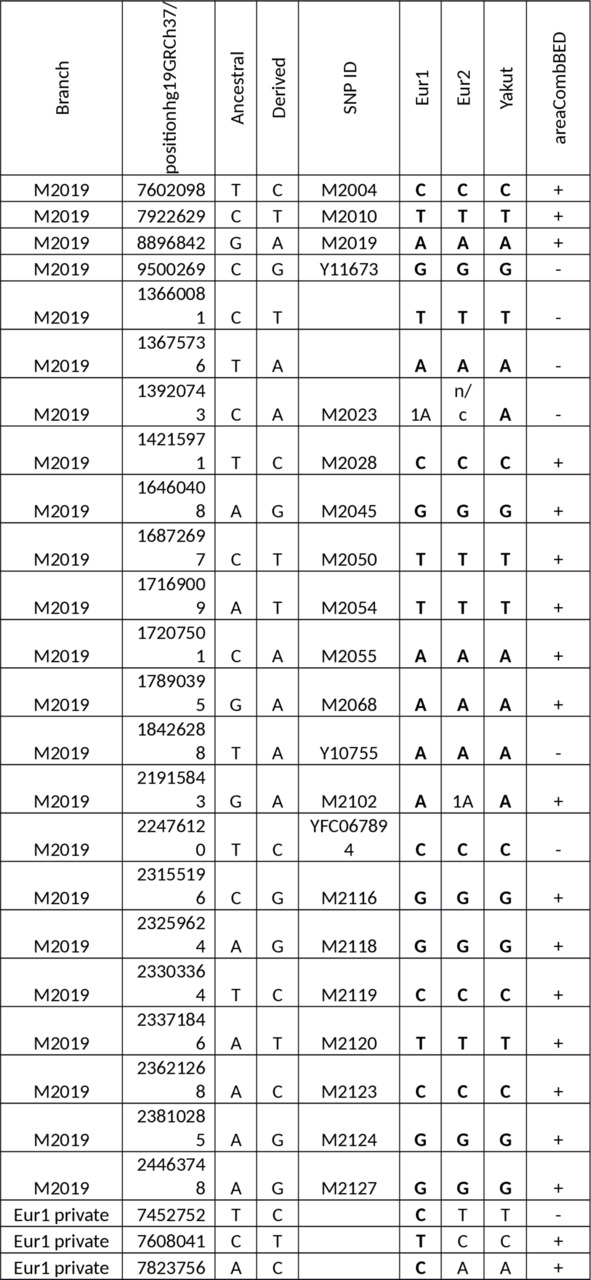
A genealogical tree of Eur1 and Eur2 and Yakut is presented in Figure 1. Substitutions located in «combBED area» (Adamov et al., 2015) are shown. Full data are present in Supplementary Table S1.
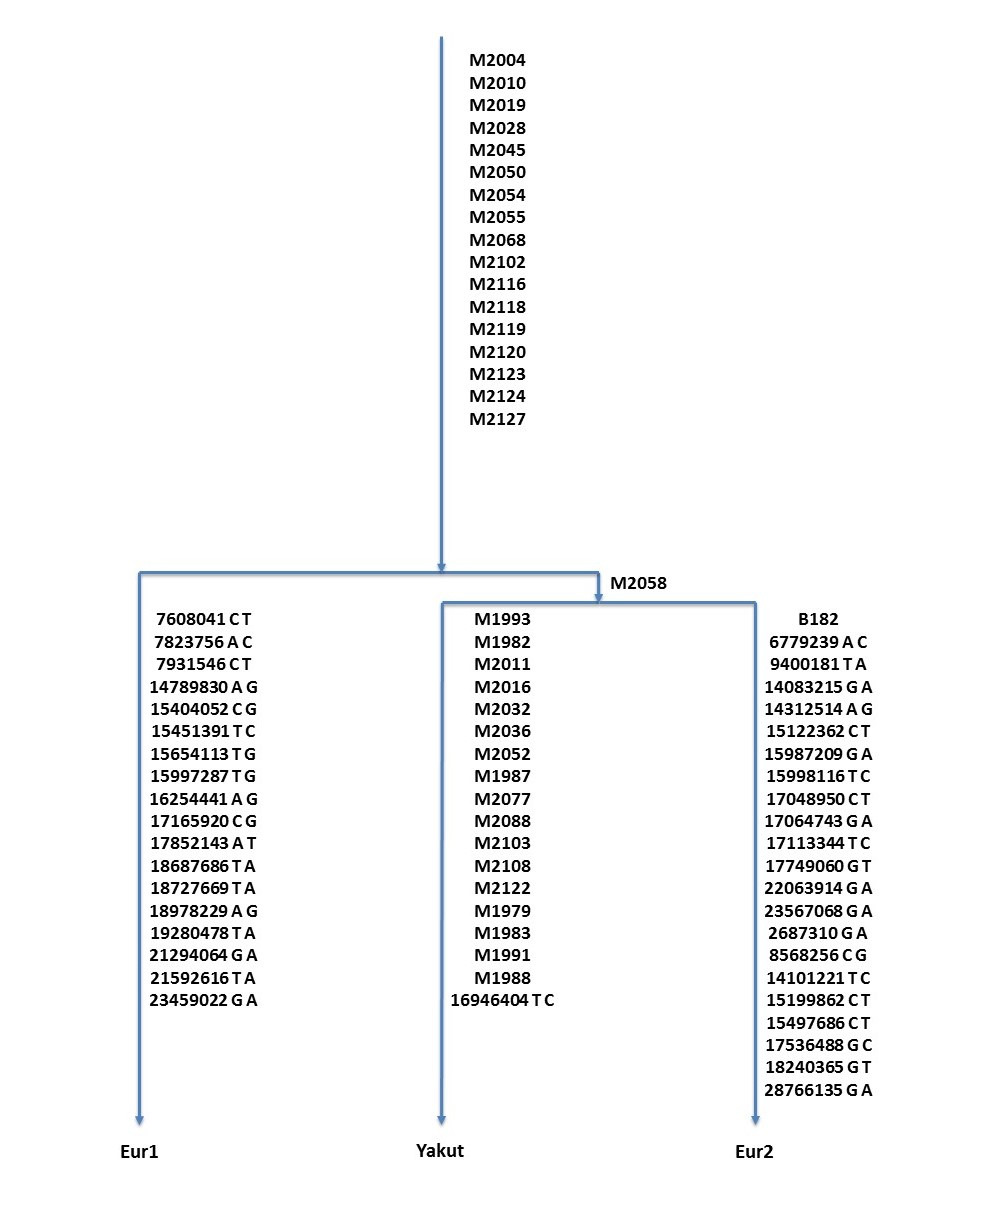
Figure 1. Genealogical tree of Eur1, Eur2, and Yakut samples. Only «combBED area» SNPs are shown.
TMRCA of Eur1, Eur2, and Yakut is estimated as 3100 years BP, 95% CI: 2300—3900 years (the method was described in Adamov et al., 2015).
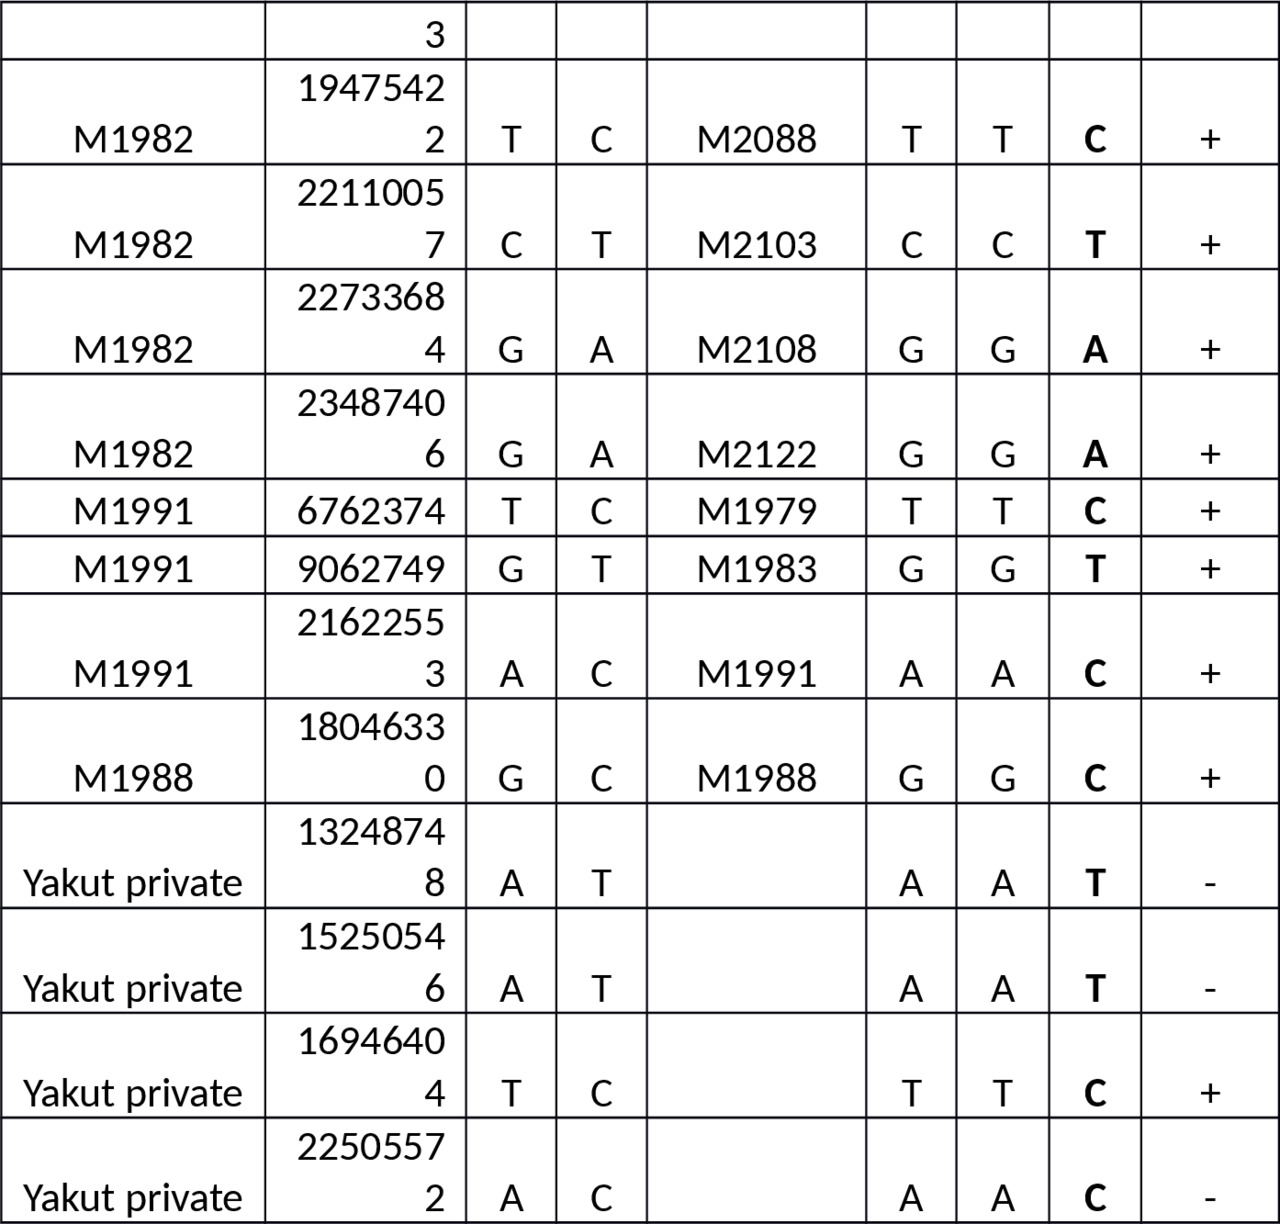
Samples Eur2 and Yakut share the single mutation M2058 in the «combBED area», so we conclude that their lines split 100—200 years later than Eur1 and Eur2 or about 2900—3000 years ago.
According to Karmin et al. (2015), the Eur2 sample belongs to the B182 lineage. Eur2 shares 14 SNPs with Lebn1 sample from Lebanon (B182 … 23567068). Hallast et al. (2014) explored 3.7 Mbp regions of Y-chromosome (about 30% of Big Y). There is tur-15 sample from Turkey which has seven common mutations with Eur2 in positions 2890144 (B182), 6779239, 14312514, 15122362, 15998116, 16037395, 17113344.
Eur1 mutations constitute separate paternal line.
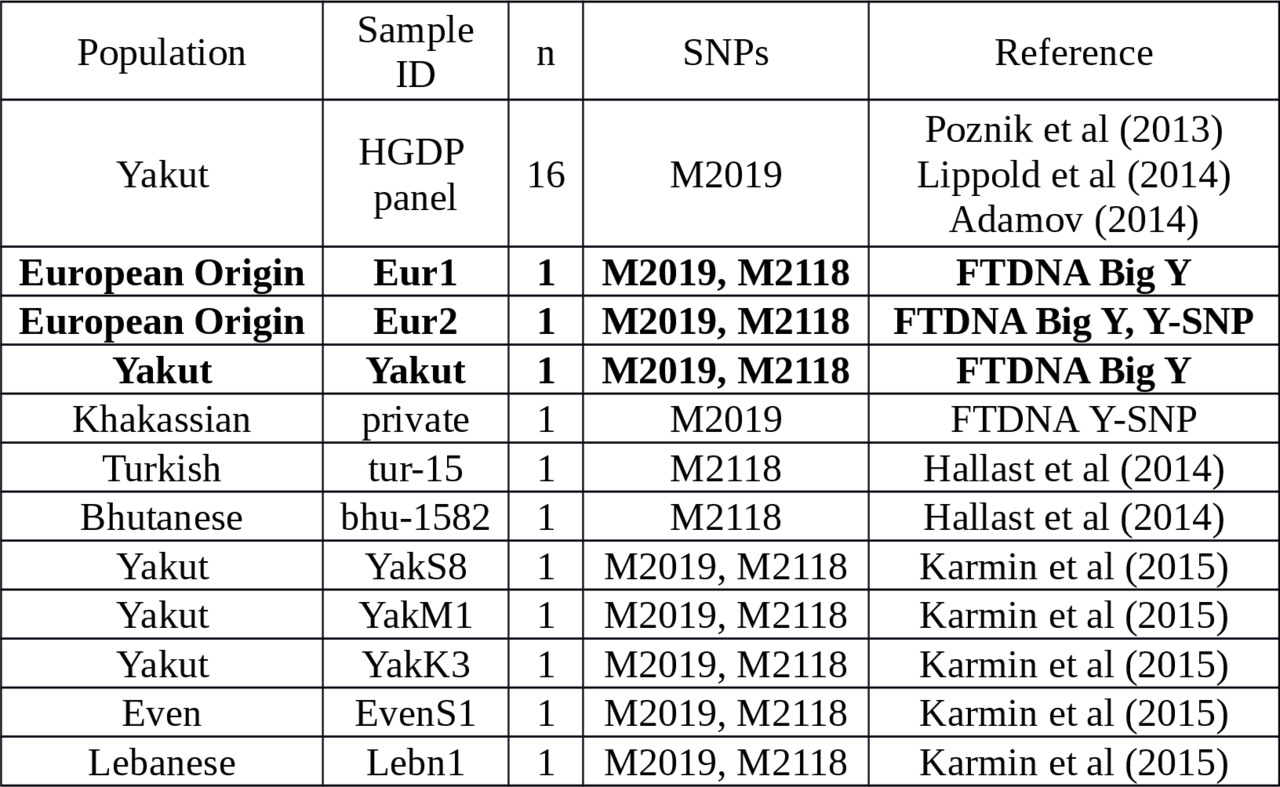
There are known limited samples with M2019 or M2118 mutations (see Table 3). M2019 and M2118 are considered to be parallel mutations (Karmin et al., 2015).
Table 3. Y-chromosome samples with approved M2019 or M2118 substitutions.
All of the samples in Table 3 are accompanied by the PowerPlex 23 STRs. It allows us to confirm the collection method of presumed M2019 Y-STR haplotypes (see Table 4 and Supplementary Table S2). The N-M2019 haplotypes are very rare worldwide excluding Yakutia.
We determined that short tandem repeats in DYS393 of the B182 lineage are extremely high, 15 or even 16 repeats. Some of the observed European Y-STR haplotypes are thought to belong to the B182 branch (see Table 4). Because they are approved as B182 the Lebanese (Lebn1) and the Turkish (tur-15) haplotypes are presented in Table 4, as well.
We suppose that the second half of the European Y-STR haplotypes in Table 4 belongs to the Eur1 paternal line.
Finally, a donor from Belgorod, Russia, appears to have a Yakut ancestor.
The B182 branch is present in Asian populations (see Table S2); however, there is no clear evidence of close relatives of the Eur1 branch in Asia (see Table S3). The branch appears to include only European samples.
Table 4. Y-STR haplotypes of the European M2019 samples.
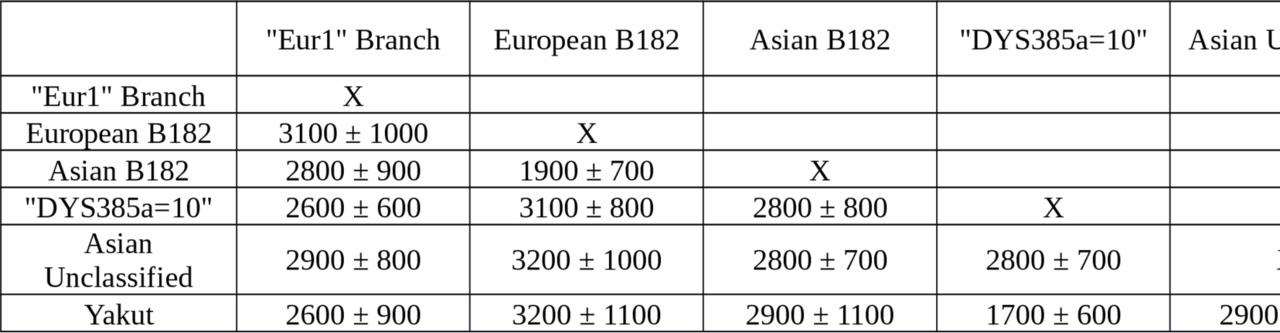
We estimated ages of the branches using 17 Y-STR loci (Yfiler). Nine B182 and ten Eur1 haplotypes were taken from Table 4. 136 haplotypes of the Yakut branch were chosen from scientific papers — Theves et al. (2010,), Xu et al. (2014,), Karmin et al. (2015,), Rootsi et al. (2007,), plus the Yakut sample haplotype. Results are presented in Table 5.


Table 5. Interclade TMRCA of B182, Eur1 and Yakut lineages estimated from Y-STR data.
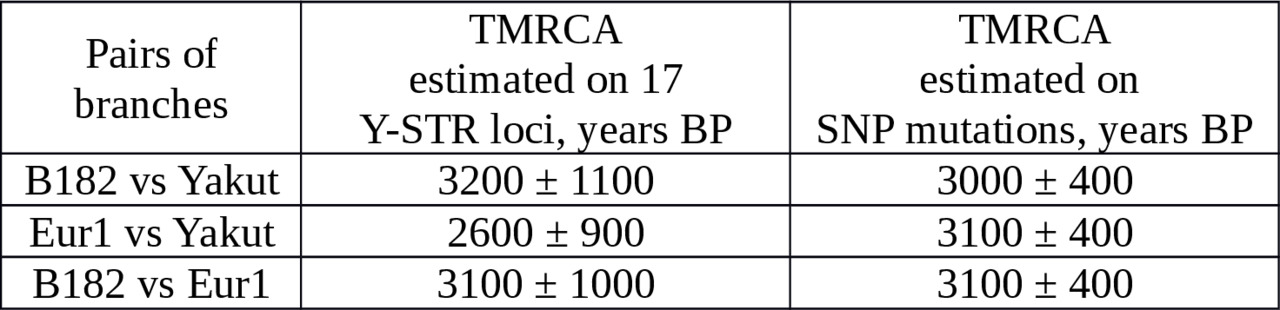
The age estimates obtained by SNPs and STRs are within confidence intervals.
What suggestions can we make?
About three thousand years ago the Most Recent Common Ancestor of Eur1 and Eur2 might have been a pastoralist herder on Central Asian steppes. That man was also the ancestor of the modern Yakuts. His descendants could have reached Europe with the Huns, the Avars, the Bulgars, the Cumans, the Mongolians, the Turks etc.
It should be noted that Eur1 branch includes ethnic Austrians, Germans, Frenchmen. The paternal origin of the Eur1 donor we used in this study is German.
Peter Puspoki Nagy wrote in his article «The power of facts» (Nagy, 1985): «After the final dissolution of the Avar Kaganate in AD. 805, Charlemagne, at the request of the already Christian Avar Kagan, Teodor, established the Avar Province in the Frankish Empire, in the newly occupied territory between Carnuntum (Deutsch-Altenburg) and Sabaria (Szombathely). Many contemporary credible sources prove its establishment and continued existence:
805. «Capcanus princeps Hunnorum Aquis ad imperatorem venit et, ut postulavit, inter Sabariam et Carnuntum habitandi locum accepit, … erat anim christianus nomine Theodorus» «The Kagan, the prince of the Avars, went to the Emperor in Aachen and, as he requested, he received the territory between Sabaria and Carnuntum, … he was Christian and his name was Teodor.» (Annales Fuldenses ad A. 805.: Annal. Regni Francorum 795. 805 Annal. Maximiniani etc. Cf. MMFH. I. 87, 40, 92, 63)».
The Avar descendants became Christians and lost both their origin and their language. The present-day Petronell-Carnuntum is located in Lower Austria, near the Wien. So some Europeans of the Austrian and German origin could have the Avar origin.
An information from Constantine Porphyrogenitus, «De Administrando Imperii» (Nagy, 1985): «At that time, the Croatians lived beyond Bajivár, where the White Croatians are now living. But one clan broke away from them, five brothers, Kluk, Lobel, Kosjenc, Muhlo and Hrvat and two sisters, Tuga and Buga and, with all their people, they marched to Dalmatia. And there they found the Avars, those who were the owners of the land. After they had been fighting for several years against each other, the Croatians gained the upper hand and killed out a part of the Avars and subjugated the rest. From that time on, that land came under the rule of the Croatians. But there are in Croatia some people who can be recognized as Avars».
In this sense, some of the inhabitants of the Balkan Peninsula could have the Avar origin, too.
A lot of the Avar burial sites are known in Austria, Hungary, Croatia etc. (see, for instance, «The Other Europe in the Middle Ages: Avars, Bulgars, Khazars and Cumans». Edited by Florin Curta with the assistance of Roman Kovalev. Brill Academic Pub. Leiden, Boston, 2008).
Taking into account not only the scientific evidence but also the evidence of these medieval documents and artifacts, we believe that the ancestors of Eur1 and Eur2 may well have been of ancient Avar paternal origin.
Conclusions
Two European men (participants of the FTDNA projects) have the same paternal origin as the Yakuts from the North-Eastern Siberia. We estimated the Time to the Most Recent Common Ancestor of the two Europeans and the Yakuts as 3100 years before the present, with a 95% CI: 2300—3900 years.
We proposed the paternal origin of any Europeans with a derived allele at M2019 to be ancient Avar.
References
Adamov D. et al. (2015) Defining a New Rate Constant for Y-Chromosome SNPs based on Full Sequencing Data. The Russian Journal of Genetic Genealogy (RE), 7, No 1: 68—89.
Adamov D. (2014) The internal structure of the Yakut branch of the Y-chromosomal haplogroup N1c1. The Russian Journal of Genetic Genealogy (RE), 6, No 1: 14—23. (In Russian)
Adamov D. and Karzhavin S. (2011) TMRCA estimates by the method of sampling pairs of STR haplotypes. The Russian Journal of Genetic Genealogy (RE), 3, No 1: 33—48. (In Russian)
Älgenäs C., Tillmar A. (2014) Population genetics of 29 autosomal STRs and 17 Y-chromosomal STRs in a population sample from Afghanistan. Int. J. Legal Med., 128 (2): 279—80.
Balaresque P. et al. (2015) Y-chromosome descent clusters and male differential reproductive success: young lineage expansions dominate Asian pastoral nomadic populations. European J. Hum. Genet., 23: 1413–1422.
Ballantyne K. et al. (2014) Toward Male Individualization with Rapidly Mutating Y-Chromosomal Short Tandem Repeats. Hum. Mutat. 35 (8): 1021—1032.
Big Y White Paper (2014). https://www.familytreedna.com/learn/y-dna-testing/big-y/white-paper/, https://www.familytreedna.com/documents/bigy_targets.txt.
Cinnioglu C. et al. (2004) Excavating Y-chromosome haplotype strata in Anatolia. Hum. Genet., 114 (2): 127—148.
Davis C. et al. (2011) Y-STR loci diversity in native Alaskan populations. Int. J. Legal Med., 125 (4): 559—563.
Donbak L. et al. (2006) Y-STR haplotypes in populations from the Eastern Mediterranean region of Turkey. Int. J. Legal Med., 120: 395–396.
Duggan A. et al. (2013) Investigating the Prehistory of Tungusic Peoples of Siberia and the Amur-Ussuri Region with Complete mtDNA Genome Sequences and Y-chromosomal Markers. PLoS One, 8 (12): e83570.
El-Sibai M. et al. (2009) Geographical Structure of the Y-chromosomal Genetic Landscape of the Levant: A coastal-inland contrast. Annals of Hum. Genet., 73: 568–581.
Erdenechimeg Ts. et al. (2012) YHRD. Contribution with the Accession Number YA003734.
Feher T. et al. (2014) Y-SNP L1034: Limited Genetic Link between Mansi and Hungarian-speaking Populations. Mol. Genet. Genomics, http://dx.doi.org/10.1007/s00438-014-0925-2.
Fenner J.N. (2005) Cross-cultural estimation of the human generation interval for use in genetics-based population divergence studies. Am. J. Phys. Anthropol. 128 (2): 415—423.
Ferri G. et al. (2008) Male haplotypes and haplogroups differences between urban (Rimini) and rural area (Valmarecchia) in Romagna region (North Italy). Forensic Sci. Int., 175: 250–255.
Gao T. et al. (2015) Phylogenetic analysis and forensic characteristics of 12 populations using 23 Y-STR loci. Forensic Sci. Int. Genet., 19: 130—133.
Gayden T. et al. (2012) Y-chromosomal microsatellite diversity in three culturally defined regions of historical Tibet. Forensic Sci. Int. Genet., 6 (4): 437—446.
Guo F. (2015) Population genetics for 17 Y-STR loci in Mongolian ethnic minority from Liaoning Province, Northeast China. Forensic Sci. Int. Genet., 17: 153—154.
Haber M. et al. (2011) Influences of history, geography, and religion on genetic structure: the Maronites in Lebanon. European J. Hum. Genet., 19: 334–340.
Hallast et al (2015) The Y-chromosome tree bursts into leaf: 13,000 high-confidence SNPs covering the majority of known clades. Mol. Biol. Evol., 32, No 3: 661—673.
Hu K. et al. (2015) The dichotomy structure of Y chromosome Haplogroup N. arXiv:1504.06463 [q-bio.PE].
Jiang X., Guo F. (2012a) YHRD. Contribution with the Accession Number YA003756.
Jiang X., Guo F. (2012b) YHRD. Contribution with the Accession Number YA003759.
Karmin M. et al. (2015) A recent bottleneck of Y chromosome diversity coincides with a global change in culture. Genome Research, http://www.genome.org/cgi/doi/10.1101/gr.186684.114.
Keyser-Tracqui C., Crubézy E., Ludes B. (2003) Nuclear and Mitochondrial DNA Analysis of a 2,000-Year-Old Necropolis in the Egyin Gol Valley of Mongolia. Am. J. Hum. Genet., 73 (2): 247–260.
Kharkov V. (2015) Private communication.
Kharkov V. et al. (2011) Genetic diversity of Khakassian gene pool: subethnic differensiation and the structure of Y-chromosome haplogroups. Mol. Biol. (Mosk.), 45 (3): 446—458. (In Russian)
Kim S.-H. et al. (2011) High frequencies of Y-chromosome haplogroup O2b-SRY465 lineages in Korea: a genetic perspective on the peopling of Korea. Investig. Genet., 2: 10.
Kwak K.D. et al. (2006) Y-chromosome STR haplotype profiling in the Mongolian population. Leg. Med. (Tokyo), 8 (1): 58—61.
Lippold S. et al. (2014) Human paternal and maternal demographic histories: insights from high-resolution Y chromosome and mtDNA sequences. bioRxiv posted online January 13, 2014. doi:10.1101/001792.
Liu Y. et al. (2014) Population genetics for 17 Y-STR loci in a Chinese Han population sample from Mudanjiang city, Northeast China. Forensic Sci. Int. Genet., 13: e16-e17.
Malyarchuk B. et al. (2013) Y-chromosome diversity in the Kalmyks at the ethnical and tribal levels. J. Hum. Genet., 58 (12): 804—811.
Mirabal S. (2010) Human Y-Chromosome Short Tandem Repeats: A Tale of Acculturation and Migrations as Mechanisms for the Diffusion of Agriculture in the Balkan Peninsula. Am. J. Phys. Anthropol. 142: 380–390.
Nagy P.P. (1985) The power of facts. Püski, New York.
Nasidze I., Schädlich H., Stoneking M. (2003) Haplotypes from the Caucasus, Turkey and Iran for nine Y-STR loci. Forensic Sci. Int. 137 (1): 85—93.
Oh Y.N. et al. (2015) Haplotype and mutation analysis for newly suggested Y-STRs in Korean father-son pairs. Forensic Sci. Int. Genet., 15: 64—68.
Ozbas-Gerceker F. et al. (2013) Population Data for 17 Y-STRs in Samples from Southeastern Anatolia Region of Turkey. Int. J. Hum. Genet., 13 (2): 105—111.
Park M.J. et al. (2012) Understanding the Y chromosome variation in Korea — relevance of combined haplogroup and haplotype analyses. Int. J. Legal Med., 126 (4): 589—599.
Poznik D. et al. (2013) Sequencing Y Chromosomes Resolves Discrepancy in Time to Common Ancestor of Males Versus Females. Science, 341: 562—565.
Purps J. et al. (2014) A global analysis of Y-chromosomal haplotype diversity for 23 STR loci. Forensic Sci. Int. Genet., 12: 12—23.
Ramos-Luis E. et al. (2013) Y-chromosomal DNA analysis in French male lineages. Forensic Sci. Int. Genet., http://dx.doi.org/doi:10.1016/j.fsigen.2013.12.008.
Roewer L. et al. (2001) Online reference database of European Y-chromosomal short tandem repeat (STR) haplotypes. Forensic Sci. Int., 118: 106—113.
Roewer L. et al. (2009) A Y-STR database of Iranian and Azerbaijanian minority populations. Forensic Sci. Int. Genet., 4 (1): e53-e55.
Rootsi S. et al. (2007) A counter-clockwise northern route of the Y-chromosome haplogroup N from Southeast Asia towards Europe. Eur. J. Hum. Genet., 15: 204–211.
Seong K.M. et al. (2011) Population genetic polymorphisms of 17 Y-chromosomal STR loci in South Koreans. Forensic Sci. Int. Genet., 5 (5): e122-e123.
Serin A. et al. (2011) Haplotype frequencies of 17 Y-chromosomal short tandem repeat loci from the Cukurova region of Turkey. Croat. Med. J., 52 (6): 703–708.
Shan W. et al. (2014) Genetic polymorphism of 17 Y chromosomal STRs in Kazakh and Uighur populations from Xinjiang, China. Int. J. Legal Med., 128 (5): 743—744.
Shi M. (2009) YHRD. Contribution with the Accession Number YA003590.
Shi M. et al. (2015) Analysis of 24 Y chromosomal STR haplotypes in a Chinese Han population sample from Henan Province, Central China. Forensic Sci. Int. Genet., 17: 83—86.
Shresta R., Wang C.-C. (2013) YHRD. Contribution with the Accession Number YA003841.
Terali K. et al. (2014) Population genetics of 17 Y-STR markers in Turkish Cypriots from Cyprus. Forensic Sci. Int. Genet., 10: e1-e3.
Theves C. et al. (2010) Population genetics of 17 Y-chromosomal STR loci in Yakutia. Forensic Sci. Int. Genet., 4: e129-e130.
Trynova E. et al. (2011) Presentation of 17 Y-chromosomal STRs in the population of the Sverdlovsk region. Forensic Sci. Int. Genet., 5 (3): e101-e104.
Uchihi R. et al. (2003) Haplotype analysis with 14 Y-STR loci using 2 multiplex amplification and typing systems in 2 regional populations in Japan. Int. J. Legal Med., 117 (1): 34—38.
Wozniak M. (2008a) YHRD. Contribution with the Accession Number YA003051.
Wozniak M. (2008b) YHRD. Contribution with the Accession Number YA003060.
Xu H. et al. (2015) Inferring population structure and demographic history using Y-STR data from worldwide populations. Mol. Genet. Genomics, 290 (1): 141—150.
YFull Experimental YTree (2015) http://www.yfull.com/tree/.
Zastera J. et al. (2010) Assembly of a large Y-STR haplotype database for the Czech population and investigation of its substructure. Forensic Sci. Int. Genet., 4: e75–e78.
Zhang Q. et al. (2006) Genetic polymorphisms of 17 Y-STRs haplotypes in Tibetan ethnic minority group of China. Leg. Med. (Tokyo), 8: 300–305.
Zhong M. (2014) Master thesis. Zhengzhou University, China. (In Chinese)
Supplementary Information
Table S1. Y-SNPs of the European samples versus the Yakut.
Abbreviations: n/c — no call, 1 — one read, 2 — two reads.
Table S2. Y-STR haplotypes of the Asian M2019 samples.
Table S2. Y-STR haplotypes of the Asian M2019 samples (continue).
Table S2. Y-STR haplotypes of the Asian M2019 samples (continue).
Table S2. Y-STR haplotypes of the Asian M2019 samples (continue).
Table S2. Y-STR haplotypes of the Asian M2019 samples (continue).
Table S3. Interclade TMRCA of the M2019 branches, estimated on 17 Y-STR loci, years before the present.
Кажется, в вашей книге есть формулы. Мы вставили их в макет, но наши заботливые роботы иногда ошибаются при этой операции. Пожалуйста, проверьте, как ваши формулы выглядят в готовом макете. Если вы заметили в формулах ошибки, попробуйте создать новую книгу в Ridero и загрузить Вашу книгу через Google Docs.
Defining a New Rate Constant for Y-Chromosome
SNPs based on Full Sequencing Data
Dmitry Adamov, Vladimir Guryanov, Sergey Karzhavin, Vladimir Tagankin, Vadim Urasin
Abstract
Two important advances: 1) the accumulation of Big Y and FGC test data, and 2) the publication of Y-chromosome sequences for three ancient samples (Anzick-1, Ust-Ishim, and K14), have made it possible to estimate the average rate of base-substitutions (SNPs). The authors of this study have developed a new method of selecting true mutations in modern and ancient samples, and have defined with high accuracy the rate constant of SNP mutations: per year per bp (95% CI:).

Introduction
A single nucleotide polymorphism (SNP) is a DNA sequence variation in which a single nucleotide (A, T, G or C) in a genome (or another shared sequence) differs among members of a species or between paired chromosomes. The authors use «SNP mutation», «base-substitution», and «mutation» interchangeably.
Substitution of one nucleotide with another during meiosis occurs at random. The probability of SNP mutations is very small: few replacements per one hundred million base pairs (nucleotide sites) occur in the course of a single meiosis. The mutation flow is rare (standard probability) and subsequent mutations do not depend on previous mutations. These characteristics determine the mutations flow as a Poisson process. The probability of mutations in the meiosis sequence within T generations is estimated using a Poisson distribution:
,
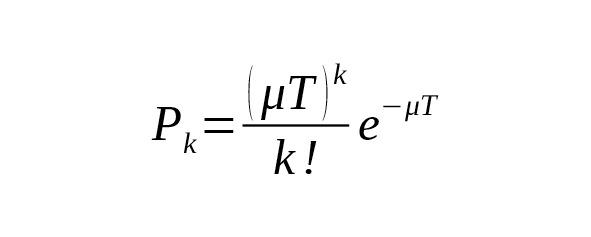
where is the probability of k mutations occurring across T generations within the same nucleotide site of the chromosome, and is the rate constant of base-substitutions.


In practice, many nucleotide sites are measured simultaneously. Let a total number of measured base pairs be denoted as B. The average number of SNP mutations () is determined by the ratio

,(1)
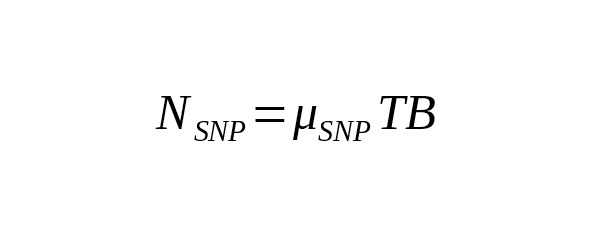
where is the rate constant of SNP mutations. For brevity’s sake, we call this the «mutation rate».

Measuring the number of mutations for genealogical purposes became possible a few years ago when high-performance Next Generation Sequencing (NGS) technologies capable of large-scale parallel reading of genomes became available at a reasonable cost.

The commercial NGS testing of Y-chromosome samples began in 2013. Table 1 summarizes the data on coverage of Y-chromosome sequences by commercial and research laboratories based on NGS technology.
Table 1. The overall size and reading quality of Y-chromosome segments.
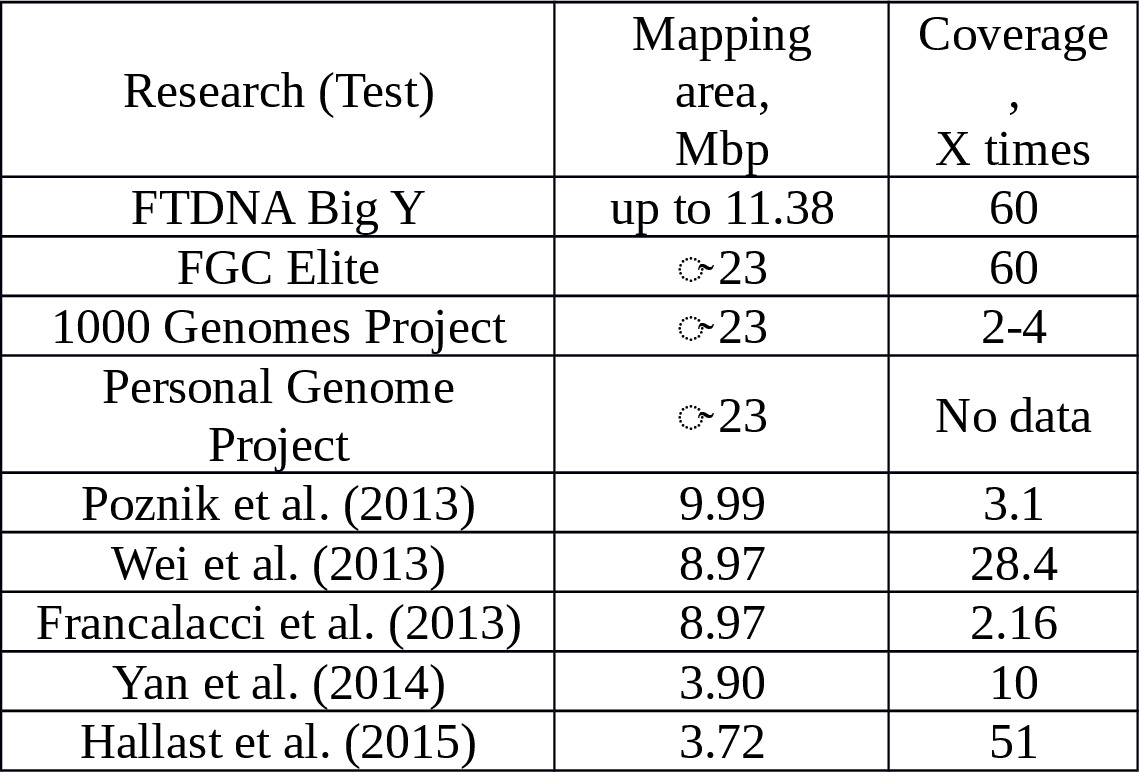
The mapped sequences of the Y-chromosome supplied by NGS technology average about 23 Mbp in length.
Skaletsky et al. (2003) noted that the structure of the Y-chromosome is heterogeneous. Y-chromosome euchromatin consists of the nucleotide sequences of the following types:
1) X-transposed, which have 99% identical analogues in the X-chromosome (total length is approximately 3.7 Mbp),
2) X-degenerated, which are unique and easily mapped sequences (total length is approximately 8.6 Mbp),
3) Ampliconic, which are segments 99.9% similar to the sequences located in other parts of the Y-chromosome (total length is approximately 10.2 Mbp, including 8 palindromic segments of 5.7 Mbp).
In scientific works, research is limited, as a rule, to the X-degenerated area. Researchers try to avoid X-transposed and ampliconic sequences. Wei et al. (2013) wrote:
We identified unique regions within the male-specific part of the Y chromosome reference sequence… where we expected read mapping and variant detection to escape complications introduced by repeated sequences. That was achieved by excluding the pseudoautosomal, heterochromatic, X-transposed, and ampliconic segments.
In Poznik D. et al. (2013) 9.99 Mbp segments of euchromatin which are the most suitable for mapping short reads (about 100 bp) were defined. These segments are basically X-degenerated and, to a lesser extent, ampliconic. Palindromic segments were excluded.
To estimate the age of male genealogical lines using the number of detected derived variants the ratio (1) is transformed as follows:
(2)
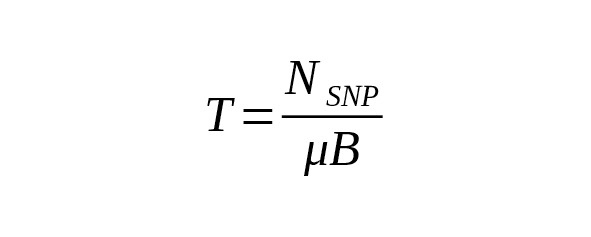
The size B of the measured and mapped area is evaluated using the BED file.
The mean mutation rate is estimated by using different calibration methods (see Wang, Gilbert, Jin, Li, 2014).
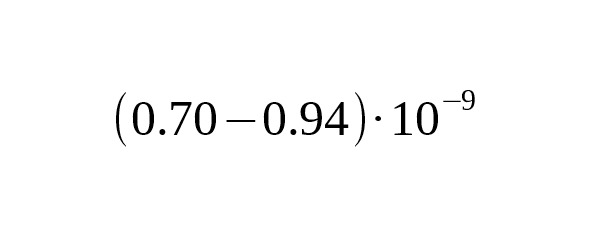
1. Kuroki et al. (2006) compared the Y-chromosome of humans and chimpanzees. Assuming that the species division occurred 6 million years ago, the average mutation rate was estimated at per year per bp, 95% CI:.

2. In their well known work, Xue et al. (2009) used samples with modern genealogies to calibrate mutation rates. Four mutations were detected in 13 generations in area with a total length of 10.15 Mbp. The mutation rate estimate was per year per bp, 95% CI:.

3. The calculations of Mendez et al. (2013), which were based on the mutation rate in autosomal chromosomes led to a slower rate at per year per bp, 95% CI:.

4. Working from the premise that America was settled by humans 15,000 years ago, Poznik et al. (2013) estimated the average mutation rate at per year per bp, 95% CI:.
5. Recent progress in the sequencing of ancient human skeletal remains has made it possible to perform a direct calibration of the average mutation rate using the number of derived alleles accumulated from the time of ancient humans. Fu et al. (2014) published the data on the complete genome of an ancient Ust-Ishim Man who lived about 45 thousand years ago in Western Siberia. On analyzing a Y-chromosomal area 1.86 Mbp long, Fu et al. estimated the rate for SNP mutations at per year per bp, 95% CI:.
Results
Selection of derived alleles
The variants of derived alleles differing from the reference sequence are contained in VCF files. Not all of them reflect actual mutations, however. Because of the peculiarities of NGS technology, the imperfections of mapping methods, the presence of repetitive chains of nucleotide sequences in the Y-chromosome, and the coincidence of sequences with analogues in other chromosomes, some of the derived variants are not real mutations. The share of erroneous choices for X-degenerated segments is not high (between 15% and 25% of the total). In ampliconic areas, however, erroneous options can be greater than the number of real mutations.
The method of selection of real mutations developed in the present study allows for elimination of erroneous alternatives from the analysis. The description of our method is contained under «Materials and Methods» below. Our method is based on the selection of X-degenerated sequences. Our SNP mutation rate calibration was carried out in what we call the «combBED» area (combined BED), which contains start and end coordinates in the hg19 system of the Y-chromosome segments, in which we expect our samples to have SNP variants. Table 1 of the Supplement to this article shows the location of 857 «good» regions of the Y-chromosome (total length of 8,473,821 bp). SNP mutation rate calibration was carried out for these areas, which will be further referred to as «combBED area».
Calibration using the ancient Anzick-1 sample
Rasmussen et al. (2014) wrote about a sample (Anzick-1) which was obtained from the bone remains of a boy who lived about 12.6 thousand years ago in the territory of what is now the State of Montana, USA. The sample was perfectly preserved, which allowed Rasmussen et al. (2014) to derive a high-quality genome sequencing for the boy. The mutations in the boy’s Y-chromosome placed him in haplogroup Q-L54. The age of the remains was determined with very high precision by radiocarbon dating. According to Rasmussen et al. (2014), the boy lived between 12,707 and 12,556 years before the present. On average, 12632 years BP.
The YFull database has accumulated unique samples of Q-L54 which we used to construct a detailed family tree for haplogroup Q-L54. The tree is shown in Figure 1. Anzick-1 is located on the same branch (Z780) as a contemporary sample taken from a present-day Native American descendant (US1). Twelve thousand six hundred years ago, US1’s ancestor was a close relative of the Anzick-1 boy.
The structure of the Q-L54 tree required that the mutation rate be calibrated in two stages. In the preliminary stage, we computed the relatively short period between the time the Anzick-1 boy lived (Z780) and the separation of L330 and M1107. Our calibrations revealed that the separation of these branches occurred very close to the generally accepted time that the settlement of Anatomically Modern Humans (AMH) in America (about 15 thousand years ago). Both branches have sample results with Big Y and FGC in numbers sufficient to achieve an accurate calibration.
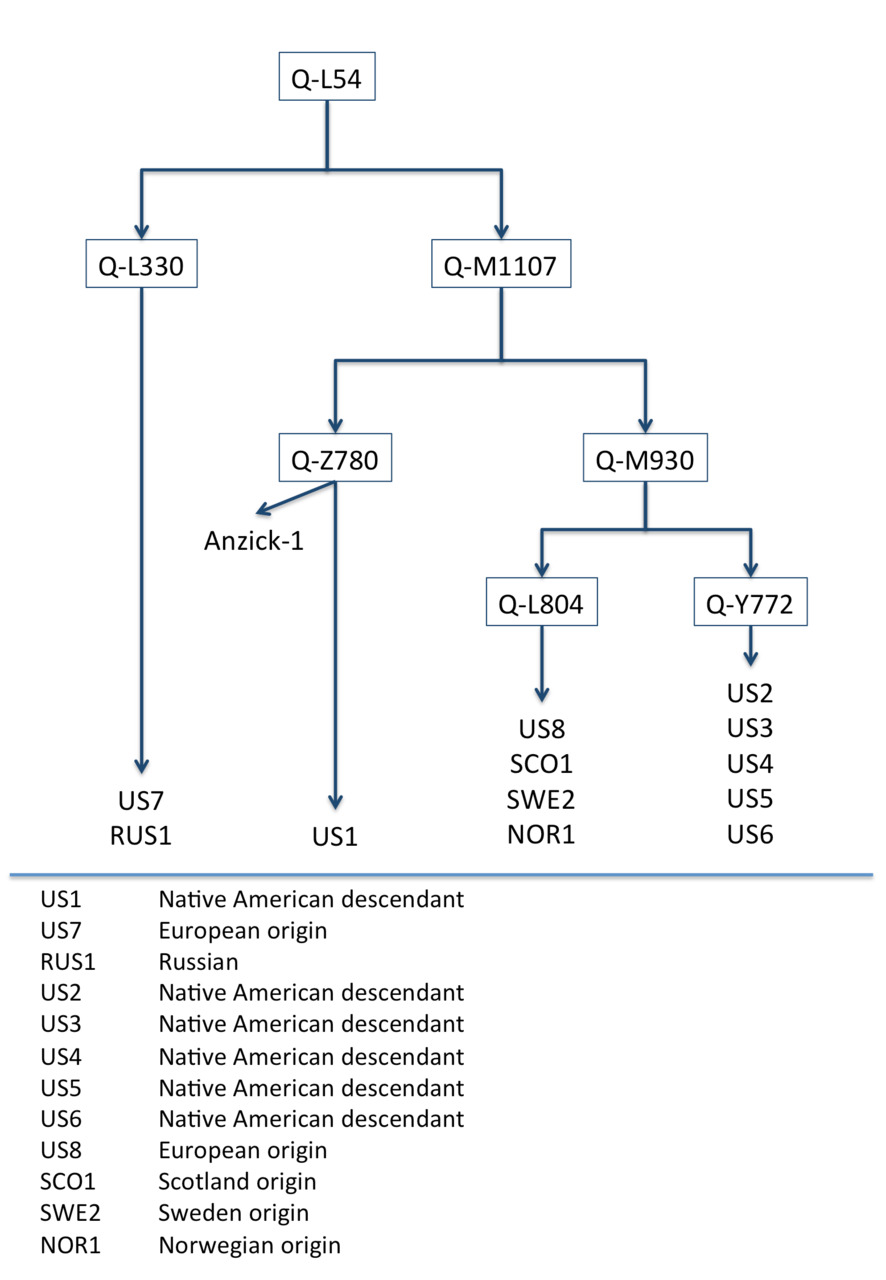
Figure 1. The family tree of haplogroup Q-L54 constructed on base-substitutions of 12 private samples and the ancient Anzick-1 sample.
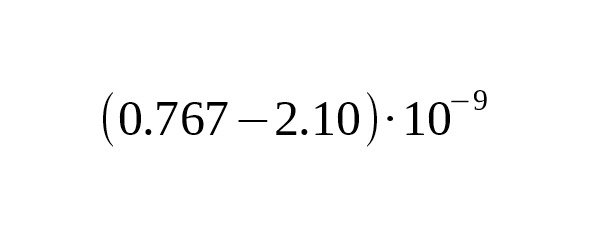
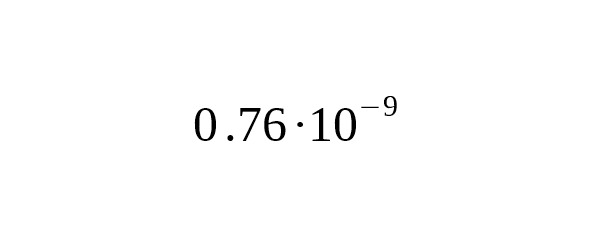
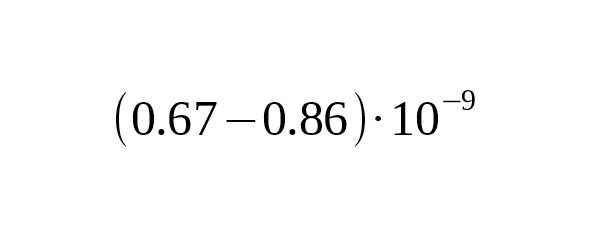
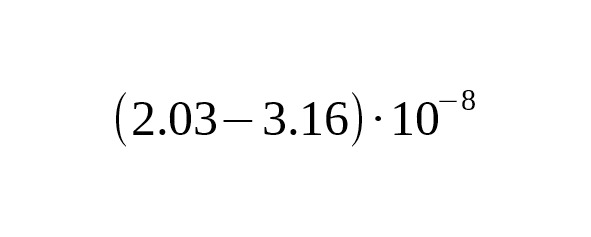
For our pre-calibration, we used the data of Anzick-1 and the data of US1 who had common ancestors at level Z780. After Z780, their lines were distinguished by distinct, differing mutations. To date, the male line of US1 has accumulated 78 mutations. In the Anzick-1 sample only one mutation is revealed later Z780 level. Based on the radiocarbon dating of the Anzick-1 sample the average rate of base-substitutions is estimated as per year per bp, 95% CI:.

We used this evaluation only for calculating the time interval between the split of the L330 and the M1107 branches and the time that Anzick-1 lived. According to the number of mutations detected in the Anzick-1 and US1 samples, the interval is approximately 2,989 years (95% CI: 1,814—4,751 years). The age of the L330 and the M1107 branches is 15,621 years before the present (95% CI: 14,446—17,383 years). The dating does not depend on any model, since the data are based on radiocarbon analysis of the Anzick-1 sample and the molecular clock of the US1 and Anzick-1 samples.
We secured eleven haplotypes from Big Y and one from FGC which were provided by contemporary individuals who belong to the branches under investigation. The samples set up four branches: Z780, L330, Y772, L804 (see Figure 1 above). With a high degree of accuracy, the branches can be assumed to be independent. This allows us to reduce the relative variance in the calibration. The results of the calibration process are summarized in Table 2.
Table 2. Number of mutations in 12 contemporary samples selected to calibrate the average rate of SNP mutations at the time of separation of the L330 and the M1107 branches.
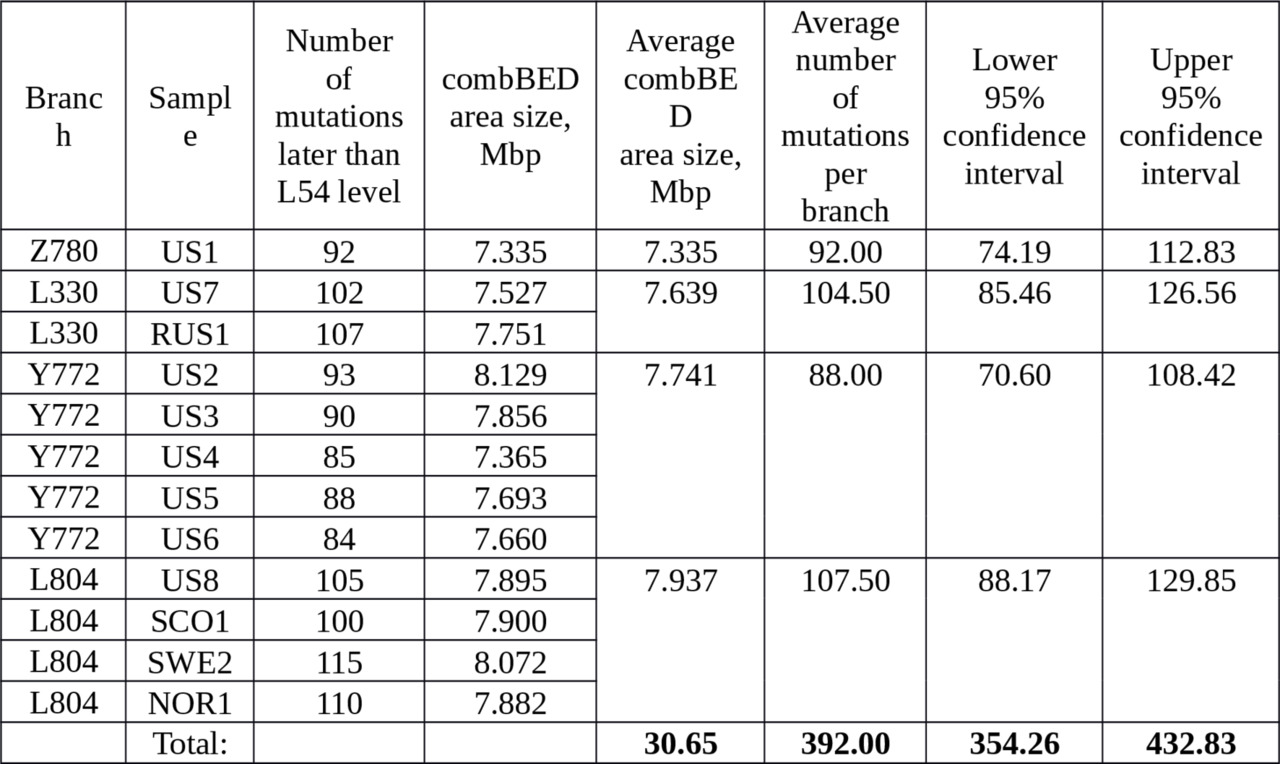
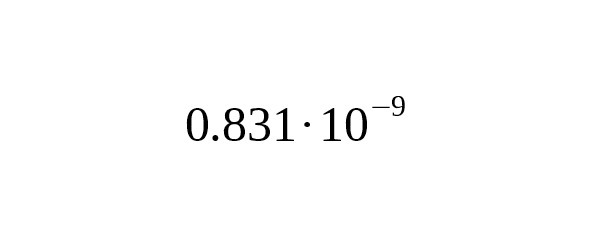
Based on the average number of mutations (392 out of 30.65 million b.p.), and the age of the L330 and the M1107 branches (15,621 years), we arrive at a final calibration rate of SNP mutations
per year per bp.
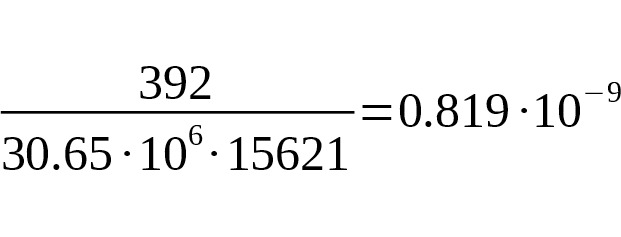
95% CI:.
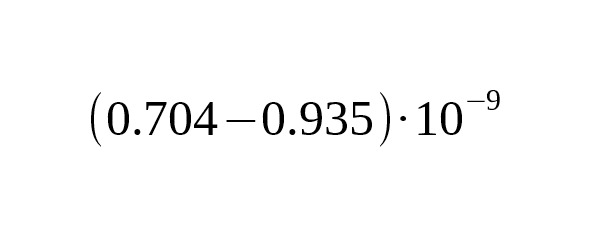
To recalculate an average rate per one generation, we take an average interval of one generation of men equal to 31.5 years (Fenner, 2005):
per generation per bp.
Calibration with modern genealogies
Some of the samples in the YFull database belong to relatives with paternal lines which can be proved by documentation. We chose 41 samples representing 14 genealogies. The number of generations to the most recent common ancestor in the samples varied from 1 to 23. We used the property that the sum of random numbers distributed according to the Poisson is a random number itself distributed according to the Poisson. In our case, it is the sum of the accumulated mutations.
The advantage of this calibration is that the exact number of generations in which private mutations occurred is known. The result of the calibration based on modern genealogies is:
per generation per bp, 95% CI:.
This is in agreement with the calibration on the dating of Anzick-1 calculated for the average interval of one generation of 31.5 years.
The average interval between generations in the chosen genealogies is 32.1 years. Therefore, the absolute calibration for one year corresponds to per year per bp.
Calibration using the Ust-Ishim sample
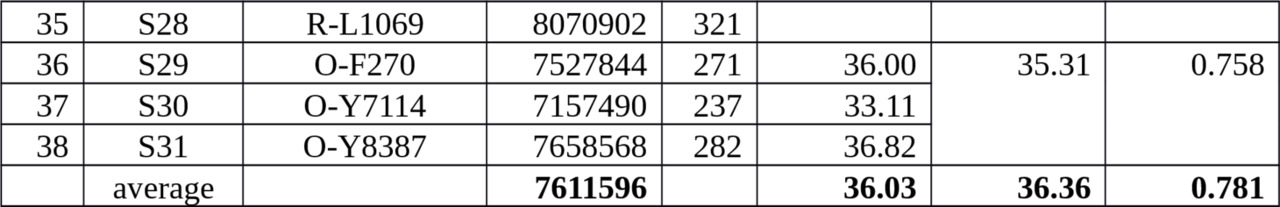
According to radiocarbon dating reported by Fu et al. (2014), Ust-Ishim Man (UIM) lived about 45 thousand years ago. On the family tree below, he is at the beginning of branch K-M2335 (see Fig. 2). Fu et al. (2014) studied the full genome of the ancient sample. The presence of a mutation at M526 placed UIM at the beginning of haplogroup K (xLT). Detailed examination of derived options revealed a later mutation (M2308/Z4842). Studying the BAM file, we identified 11 mutations (including M2308), which emerged after M526 in the combBED area (total length of 8.463 Mbp). This number was used to calculate the average mutation rate.
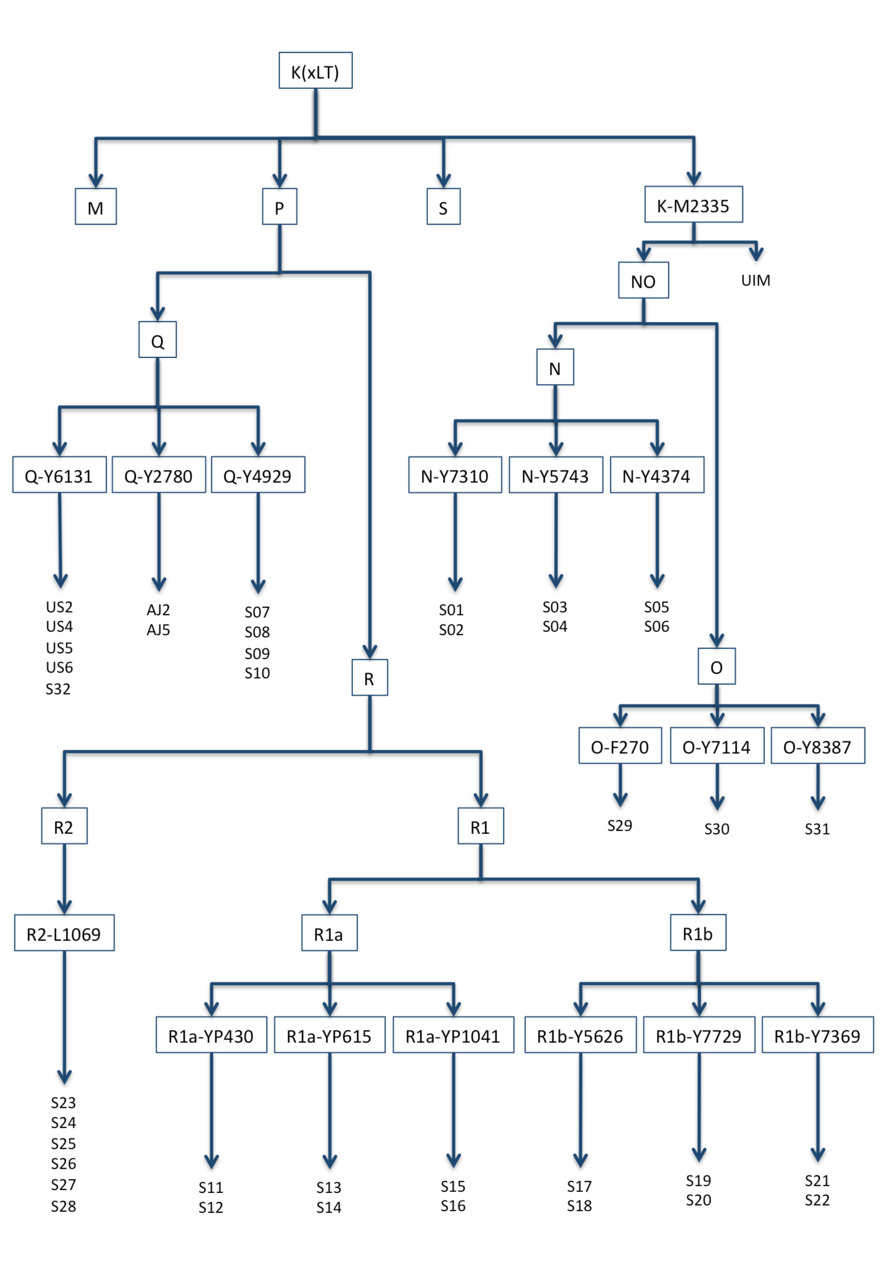
Figure 2. Haplogroup K (xLT) family tree constructed on base-substitutions of 38 private samples and the ancient sample of Ust-Ishim Man (UIM).
For the calibration, haplogroups N, O, Q, and R are appropriate.
In order to reduce possible errors to a minimum, we selected from the YFull database 35 samples with at least one fairly close relative and three samples (of haplogroup O) who were not close relatives (see Fig. 2). Table 3 shows the number of identified mutations in these samples downstream of K (xLT).
Table 3. The number of actual mutations in 38 samples collected to calibrate an average rate of SNP mutations at Ust-Ishim Man’s dating.
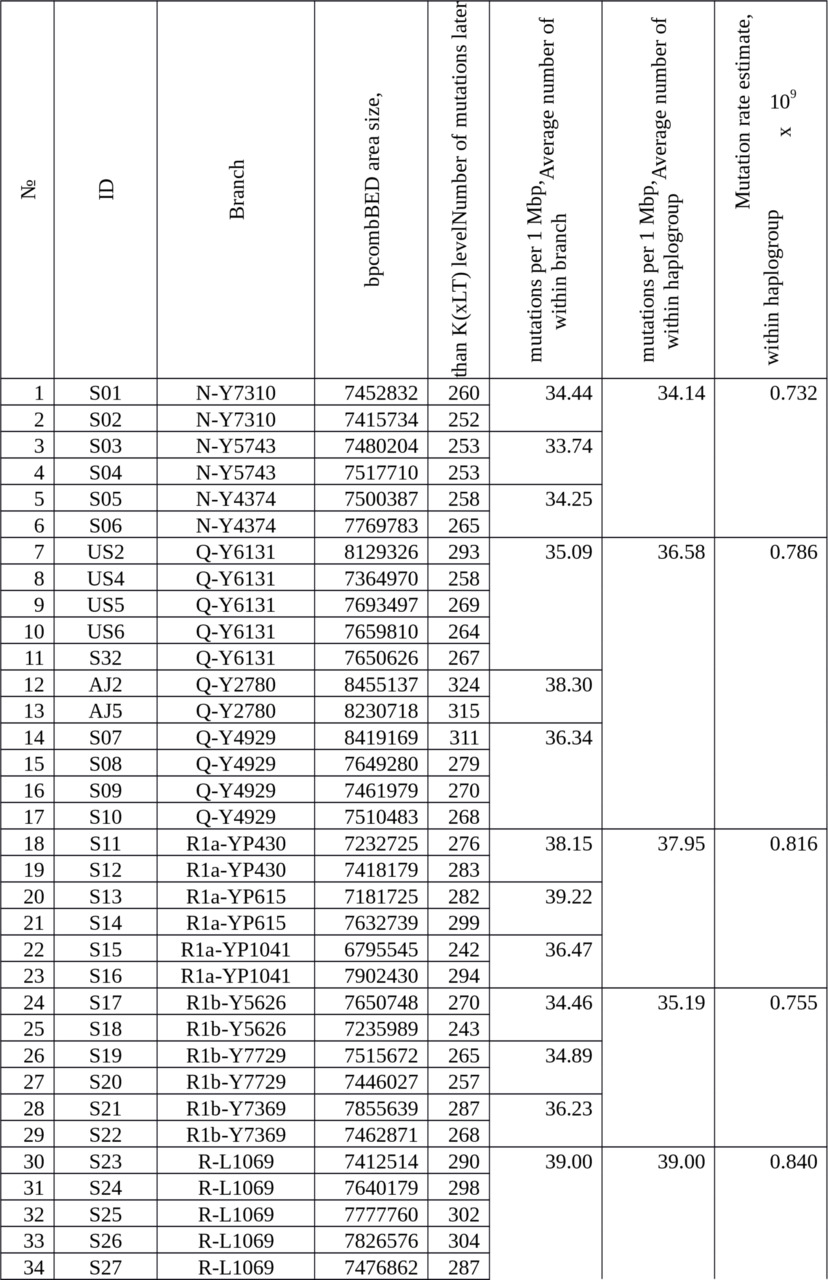
The average number of mutations occurred later K (xLT) level is 36.36 mut./Mbp.
The correction for UIM mutations is:
mut./Mbp.
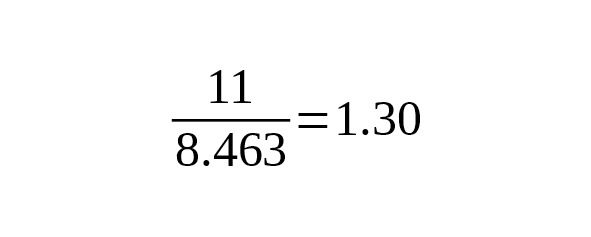
The estimate of the mutation rate is
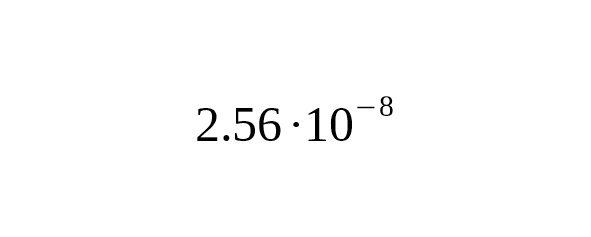
per year per bp.
95% CI:.
Calibration using the K14 sample
Seguin-Orlando et al. (2014) studied a genetic sample (K14) secured from a male bones found in Kostenki, Russia. According to radiocarbon dating, the sample is 37 thousand years old. The quality of the K14 genetic sample is not as good as either the Ust-Ishim sample or the Anzick-1 sample.
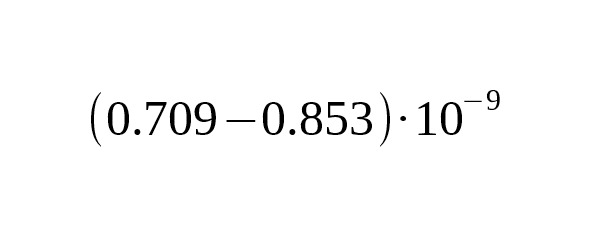
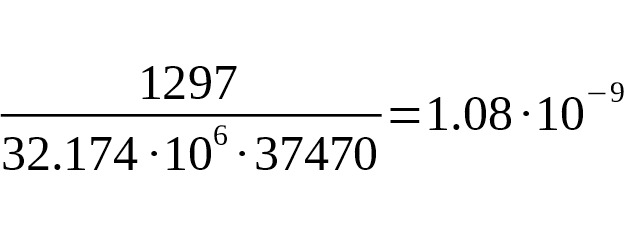
Published accounts of the sequencing reveal that it is only possible to estimate the upper limit of the mutation rate. Still, in the K14 sample we can confidently read two derived alleles at K29 and CTS6773 (combBED area length of 1.381 Mbp). According to YFull, this is the beginning of haplogroup C1. Unfortunately, the other 15 candidates identified in the sample have poor coverage, mainly 3X-5X and cannot be used for calibration. Still, with the confirmed SNPs, we were able to calculate an upper limit for the mutation rate.
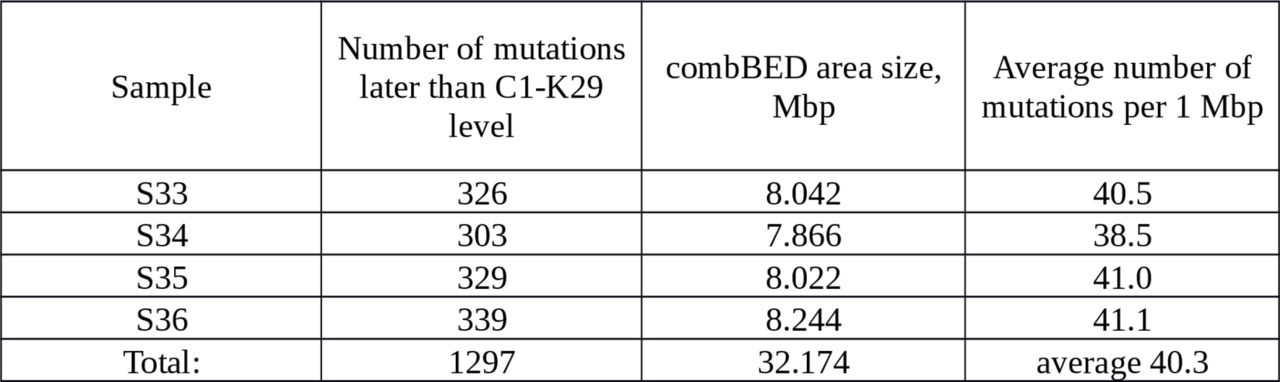
In the YFull database there are four samples from branch C1-K29; details are given in Table 4.
Table 4. The number of actual mutations in 4 samples collected to calibrate an average rate of SNP mutations at K14 dating.
The upper limit of SNP mutation rate is estimated as:
per year per bp.
This result agrees with other calibrations, but is not of practical importance.
Coefficients for age estimate
It is convenient to estimate genealogical age directly from the actual number of mutations. The formula for calculation of the coefficient is derived from equation (2). It is:
(3)

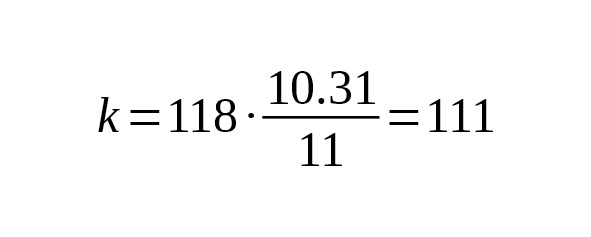
It is essential for researchers to know the value B of the measured area length. For Big Y, the confidence regions length averaged over individual bed files is 10.31 Mbp (Big Y White Paper, 2014). For FGC Elite, the length is 23 Mbp. At the average mutation rate the coefficient (formula 3) is 118 years for Big Y, and 53 years for FGC.

If the size of the measured area changes, it is necessary to recalculate the coefficient. For example, if the measured area of Big Y were not 10.31 Mbp but 11.0 Mbp, then the coefficient would be
years per base-substitution.
For a more effective selection of actual mutations, we recommend that any research area be within the boundaries of the combBED area. The size of the combBED area in individual Big Y samples varies and the average is about 7.6 Mbp. The appropriate conversion factor, therefore, is 160 years per base-substitution.
Discussion
We used four methods of calibrating the rate of SNP mutations. The four methods are within measurement accuracy, and are consistent.
The values of the rate constant obtained by the dating of the ancient Anzick-1 sample and of contemporary genealogies are in agreement. These are the most accurate calibrations.
The difference between the results of the calibrations between Anzick-1 and UIM is only 5%. However, we should note two things about the sequencing UIM calibrations:
1) Radiocarbon dating estimates the age of UIM as approximately 45,000, which is quite close to the reliability limit of radiocarbon dating (50,000 years).
Calibrating UIM with the Anzick-1 sample (using the rate) we estimate Ust-Ishim Man’s age to be 42,800 years (95% CI: 49,800—37,500). Fu et al. (2014) estimate the age of UIM at between 46,880—43,210 years, with a 95.4% confidence level. Although our value (42,800 years) falls slightly outside the radiocarbon calibration, the lower estimate falls within measurement accuracy.
2) We cannot be sure of the average interval of generations for men who lived thousands of years ago.
The rate constant of base-substitutions per calendar year () is associated with a constant per one generation () using the ratio


,

where is average interval of one generation (father’s average age).

Kong et al. (2012) made an analysis of the complete genomes of 78 parent-offspring trios (i.e. father-mother-offspring). The study strictly confirmed the fact that the number of mutations per meiosis increases with the age of the father. For the purposes of our study, we represented the increase of base-substitutions in a father’s gametes versus his age t as a power-law

According to genomes of five parent-offspring trios (Kong et al., 2012).

If we assume that the number of mutations in the Y-chromosome of the son increases in proportion to the age of the father (γ = 1), the average rate of SNP mutations based on a calendar year will not depend on the average interval of one male generation.
In general, the mutation rate per year will be described by a ratio:
.(4)

This ratio is useful for understanding the relationship between the change in the average age of a father and the corresponding change in the mutation rate for one year. Suppose we observe a decrease in the rate constant of mutations in one calendar year during the transition from one calibration to another. When, this reduction corresponds to the decrease in the father’s average age. If, the decrease in the rate of mutations indicates, on the contrary, an increase in the father’s generation interval.


Our understanding of the lives of humans during the Paleolithic (12,600—45,000 years BP) makes us think that the average interval of one male generation was less than 31 or 32 years. The average mutation rate calibrations of Anzick-1 and Ust-Ishim do not show any significant difference. This suggests a linear relation of the mutation rate per generation with the age of the father. In any event, the mutation rate per one calendar year slightly depend on the male generation interval.

In general, our results are consistent with recent data available, including Poznik et al. (2013), Fu et al. (2014). However, our rates are more accurate.

According to Poznik et al (2013), their method of mutation rate evaluation depends on the age of separation between the lines represented by Maya samples HGDP00856 and HGDP00877. HGDP00856 enters the Q-Y772 branch and HGDP00877 enters the Q-Z780 branch. Poznik et al. supposed this time to be 15,000 years BP (the first settlement of America). In our work, we don’t use an arbitrary parameter to estimate the date at which these two genetic lines split, instead, we base our calculations using the Anzick-sample. Replacement of the age parameter (15,621 instead of 15,000) reduces the mutation rate in Poznik et al. (2013) to.
The base of mutation rate evaluation in Fu et al. (2014) paper is 45000 ∙ 1.86 = 83,700 Mbp∙year. Our evaluation base, using the Anzick-1 sample, is much larger: 15621 ∙ 7.7 = 120,000 Mbp∙year. A 7.7 Mbp length is calculated by averaging over 12 modern samples bed files (see Table 2). The quality of the data in the Anzick-1 sample is higher than the quality of the data collected from the Ust-Ishim sample.
Kuroki et al. (2006) estimates the mutation rate (), since the ancestors of humans and chimpanzees separated. This estimate is 80% higher than our.

The pioneering work of Xue et al. (2009) established the rate per year per bp which contributed greatly to the development of genealogical research on the Y-chromosome. Our research, however, has shown that the calibration Xue et al. obtained in four derived alleles is outdated.

The rate from the work of Mendez et al. (2013) seems to us to be underestimated. The criticism of Mendez et al.’s mutation rate conversion method from data on autosomal chromosomes is contained in Sayres (2013).
Overall, the results of our research on the rate constant of base-substitutions are consistent with the conclusions of Wang, Gilbert, Jin, Li (2014) in their paper, «Evaluating the Y chromosomal timescale in human demographic and lineage dating».
The probable time America was first settled is revealed by the structure of the branches of Q-M1107 (see Figure 1, above). Currently, two branches are known to extend from M1107: branch Z780 and branch M930. Z780 occurs exclusively in the male lines of Native Americans (Indians). The L804 sub-branch of M930 is classed as European (the members of L804 seem to have remained in Eurasia) while those with the Y772 sister-mutation appear to have migrated to America. There are only four mutations at the same level as M930 in combBED area. There are five samples of sub-branch Y772 and four samples of sub-branch L804. The age separation of M930 is estimated at about 14,800 years. We believe this is closest to the time of the settlement of America. Our estimate agrees with the results of the those who study the settlement of America specifically: they assert that humans appeared in the America no later than 14 thousand years ago (Barnosky et al., 2014). We note that the first male immigrants to America do not belong to only one haplogroup: they belong not only to M930 but also to Z780 like the ancestors of Anzick-1.
Hallast et al. (2015) published research on two samples of the aboriginal population of Australia. Mutations F3393 and K35 (measuring 3.7 Mbp) indicated that the samples belong to haplogroup C1 (see YFull tree at http://www.yfull.com/tree/C/). We found that 129 SNPs (of Hallast et al., 2015) in the Australian samples are distinct from the C1a and C1b branches in the Y Full data base. To determine the date of the first settlement of Australian Aborigines, we sought to calibrate the time of the separation of haplogroup C1 from its subclades C1a and C1b. Using four modern samples C-V20 (see Table 4 above) we arrived at 49,200 years (95% CI: 43,900—54,600). This result is in agreement with the estimates archaeologists O’Connell and Allen (2004) and Hiscock (2013) give for the peopling of Sahul: approximately 50 thousand years ago.
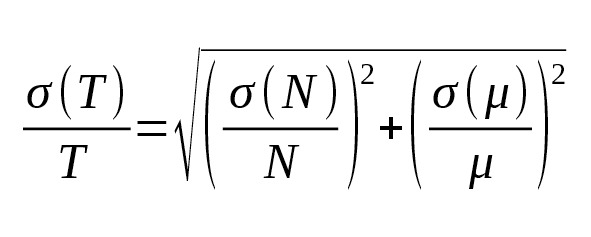
On the basis of probability theory we obtained from formula (2) an estimate of the root-mean-square (r.m.s.) error:
(5)
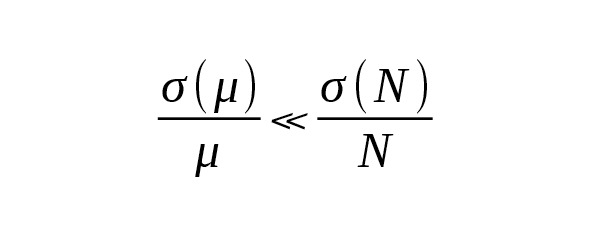
With the large number of independent measurements, the average mutation rate can be evaluated with high relative accuracy:
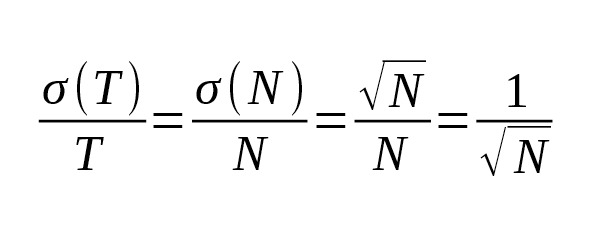
(6)
In this case, the age estimation accuracy would be determined only by the number of mutations:
(7)
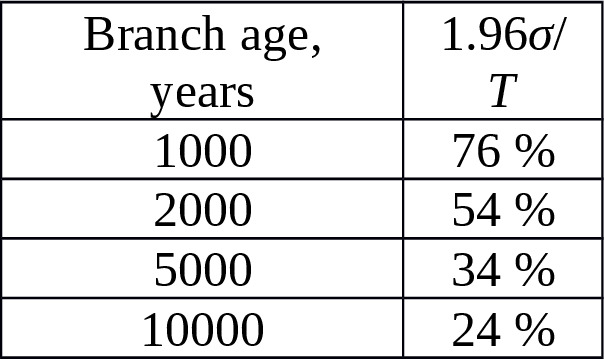
Equation (7) allows us to calculate the theoretical limit of accuracy of the SNP branch age estimation. Table 5 shows the relative confidence intervals for the 95% probability (i.e. 1.96σ/T) for the next parameters:, bp.
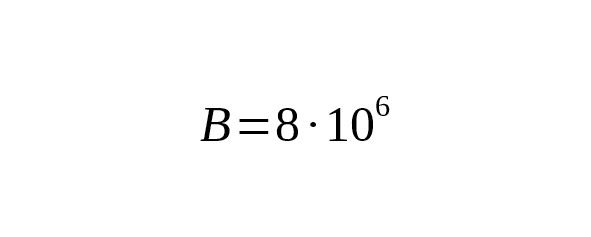
Table 5. The theoretical limit of accuracy of the age estimation versus the SNP branch age.
We could double the accuracy of the limits specified in Table 5 if we selected actual mutations among ampliconic segments (+10 Mbp added to the combBED area), and take into account second SNP branches (+N substitutions).
Materials and methods
In order to calibrate the average rate of mutations, we used private Y-chromosome NGS data from two commercial laboratories, FTDNA and Full Genome Corporation. The private samples were provided by the YFull team in compliance with the confidentiality requirements for personal data. All the persons had given individual permits for the use of their data for research.
The data on the ancient Y-chromosome samples were taken from scientific articles: Anzick-1 from Rasmussen et al. (2014), Ust-Ishim Man from Fu et al. (2014), and K14 from Seguin-Orlando et al. (2014).
We developed a selection method which effectively excluded from consideration false options with derived alleles («false positives»). We used the following filtration criteria:
1. «Reg» criterion. There are derived variants (i.e. alleles different from the reference sequence) revealed in the BAM files. The nucleotide sequences under investigation had a total length between 13—15 Mbp for Big Y, and about 23 Mbp for FGC. Single base read coverage varied from 1X to 8000X. The average coverage of commercial samples is about 60X. From this set of variants, we selected only those coordinates that fell into the combBED regions. As it was mentioned above, the combBED area was designed by the authors to select X-degenerate segments. The combBED area borders were formed by mutual overlapping BED file taken from the work of Poznik et al. (2013) (total length of 10.45 Mbp) and by the generalized Big Y BED file (11.38 Mbp long), published in the Big Y White Paper (2014). The result was 857 continuous segments of the Y-chromosome with a total length of 8,473,821 bp. The coordinates of the beginning and the end of these regions are contained in Table 1 of Supplement.
Бесплатный фрагмент закончился.
Купите книгу, чтобы продолжить чтение.