
Бесплатный фрагмент - Data Order Market Exchange Trader
Introduction
Trading is the ability to see cause-and-effect relationships where most people see only candles and indicators. If the first book introduced the language of basic market data (volume, delta, limit orders, heatmaps) and taught you to recognize the “footprints” of market participants, this book focuses on how those footprints are formed in real time inside the order book (DOM/LOB) and the time & sales tape (T&S), and how to make precise decisions based on this micro-mechanics.
We move to the matching process itself: from adding and canceling limit orders to queues, priorities, trade aggressors, tick-by-tick transitions, bursts and decay of aggression. You will learn to read context → trigger → confirmation → invalidation at the level of individual ticks and queues, combining the order book, the tape, and the chart into a single coherent scene.
Why the second book matters
— Understand the root causes of volume and delta signals: why “there was a lot of volume” and what exactly created it.
— See the participant behind the trade: aggressor vs. passive side, execution priority, the “signature” of a systemic player.
— Filter illusions: distinguish bait from real intent; recognize absorption, icebergs, spoofing and refresh.
— Bring order to micro-noise: uptick/downtick, bid-ask bounce, tick/time/volume aggregates and their filtering.
What you will learn
— Order Book (DOM/LOB): Bid/Ask structure, spread and mid, depth, “walls” and “ladders,” queues and their imbalances, microprice.
— Time & Sales (T&S): trade aggressor, tick classification, aggregated vs. single prints, size series, stop flows (sweep/exhaustion), bid/ask flip.
— Order-flow patterns: absorption and icebergs, spoof/refresh, “volume inflation,” “volume spread,” and the 50% equilibrium level.
— Practice & participants: indirect estimation of open interest, identifying the side and number of participants in aggregation, the “large-player signature,” and combining tick charts, tape, and DOM to verify hypotheses.
How to work with the book
— Start with the Glossary and Settings Guide: quickly configure DOM and T&S for the task — levels, columns, filters, multi-window layouts, chart aggregates.
— Then move through four chapters: from order book mechanics and ticks to patterns and practical participant recognition.
— Always follow three steps: context (what’s happening with queues/spread) → trigger (what exactly was the event) → confirmation/invalidation (what proves or disproves the hypothesis).
— Practice: tape replay, tick markup, calculation of simple metrics, mini checklists for trades and post-analysis.
Who this book is for
— Traders who want to move from an indicator-driven view to a behavioral one — reading queues and aggression.
— Those already using volume/delta/footprint tools and seeking to understand the root causes of signals.
— Algo and quant practitioners — as an operational description of microstructure and a source of testable rules.
Chapter 1 ● Order Book Mechanics
1.1 Quote Book (Bid/Ask), Spread, Mid Price, Tick Size
1.2 Order Queue and Execution Priorities
1.3 Market Depth and Liquidity Asymmetry; Walls and “Ladders” (Stacked Liquidity)
1.4 Queue Imbalance (L1–L10) and Microprice
Chapter 2 ● Time & Sales Tape. Tick Structure
2.1 Interface and Core Fields
2.2 Trade Side Identification
2.3 Aggregation. Single Trades. Metrics
2.4 Tape ↔ Chart: Tick-Based and Time-Based Representations
2.5 How to Read Limit Orders through the Tape
Chapter 3 ● Order Flow Patterns: Tape · Chart · DOM
3.1 How to Work with Order Flow Patterns
3.2 Absorption and Icebergs (Absorption, Iceberg / Refresh)
3.3 Stop Runs, Bursts, and Volume “Manufacturing”
3.4 Spoof / Refresh and Behavioral Traps
Chapter 4 ● Practice: Market Participants and Implied Open Interest
4.1 Indirect Estimation of Open Interest
4.2 Identifying Trade Side and Number of Participants
4.3 Systematic Participant and Market Maker
● Conclusion
● Book Three
Preface●
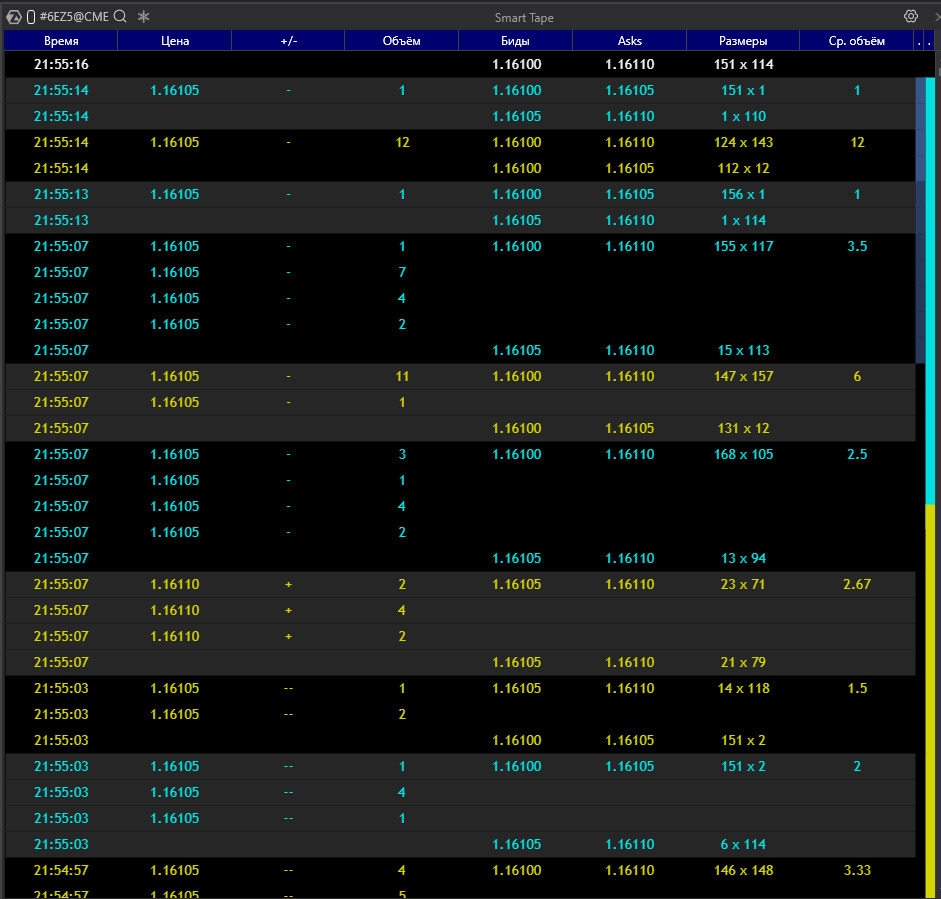
Print tape (T&S):
Definition A row-by-row stream of already executed trades.
Each row represents an execution fact (a match) between an aggressor and a resting limit order.
How to Read the Columns in the Screenshot
— Time — the moment of execution; dense “clusters” of rows indicate bursts or trade series.
— Price — the execution level.
— +/− — tick direction:
— + (uptick, hit on the Ask),
— — (downtick, hit on the Bid),
— — (no price change).
— Volume — trade size (or the summed size of aggregated small prints).
— Bids / Asks — best L1 quotes at the moment of the print (spread context).
— Sizes — visible depth at the best Bid × Ask at the time of execution (e.g., 151 × 114).
— Avg. Volume — average size within the package if the row is aggregated.
Aggregated / “Whole” Rows
— Gray or highlighted blocks with large numbers represent aggregation of prints close in time and price into a single package (volume is summed).
— This is a visual aggregation, not a guarantee of a single counterparty; it is used as a noise filter and for reading execution tempo.
— Series of “+” at the upper quote with a stable Ask → buyer-aggressor hitting the offer; watch whether the spread expands and whether the level holds (absorption / refresh).
— Series of “−” at the lower quote with a stable Bid → seller-aggressor.
— Large packages at one level after a key price is touched → likely a stop flow (sweep / exhaustion).
— Repeated identical sizes in a row → a possible “signature” of a systematic participant or algo.
Why the Tape Matters
The tape shows actual hits on liquidity: where, by which side, and at what pace.
It helps distinguish displayed density in the order book from real interest and capture moments of flips and stop releases.
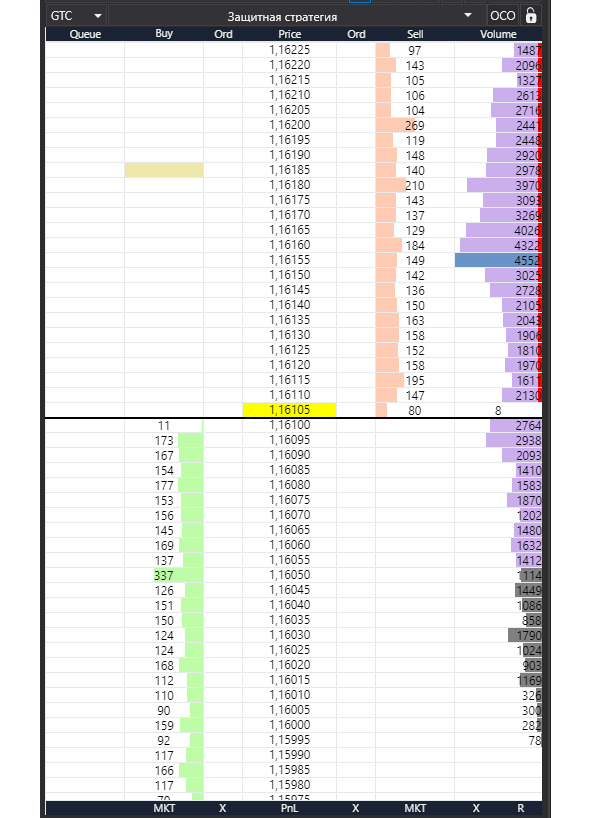
Order Book (DOM / LOB):
What it is.
Two queues of limit orders arranged along a price ladder: Ask (sell orders) on top and Bid (buy orders) below. Between them lies the price ladder itself.
How to Read It on the Screen
— Price — the price scale. The yellow band marks the current price / last print; asks are above it, bids are below.
— Sell / Buy (level volumes) — how many lots are resting as limit orders at each price level. Dense blocks = “walls.”
— Ord / Queue — the number of orders and/or your position in the queue at that level (if the platform provides it).
— Volume histogram on the right — cumulative traded volume by price (volume profile); do not confuse this with resting limit orders.
Key Concepts
— L1 (best quotes) — the top Ask and bottom Bid;
— L2…Ln — depth further away from the market.
— Depth — how many levels are visible / available. The cumulative depth on each side matters most.
— Spread — the difference between Best Ask and Best Bid.
— Narrowing = more liquidity at L1; widening = thin market or aggressive pressure.
— Mid — the midpoint between the best quotes:
— (Best Bid + Best Ask) / 2.
— Useful as a reference axis for pegged orders and balance assessment.
What to Watch First
— Depth asymmetry (significantly more liquidity on one side) → higher probability of price being pulled or a level being defended.
— Walls / “ladders” (repeating volume blocks step by step) → potential reaction zones.
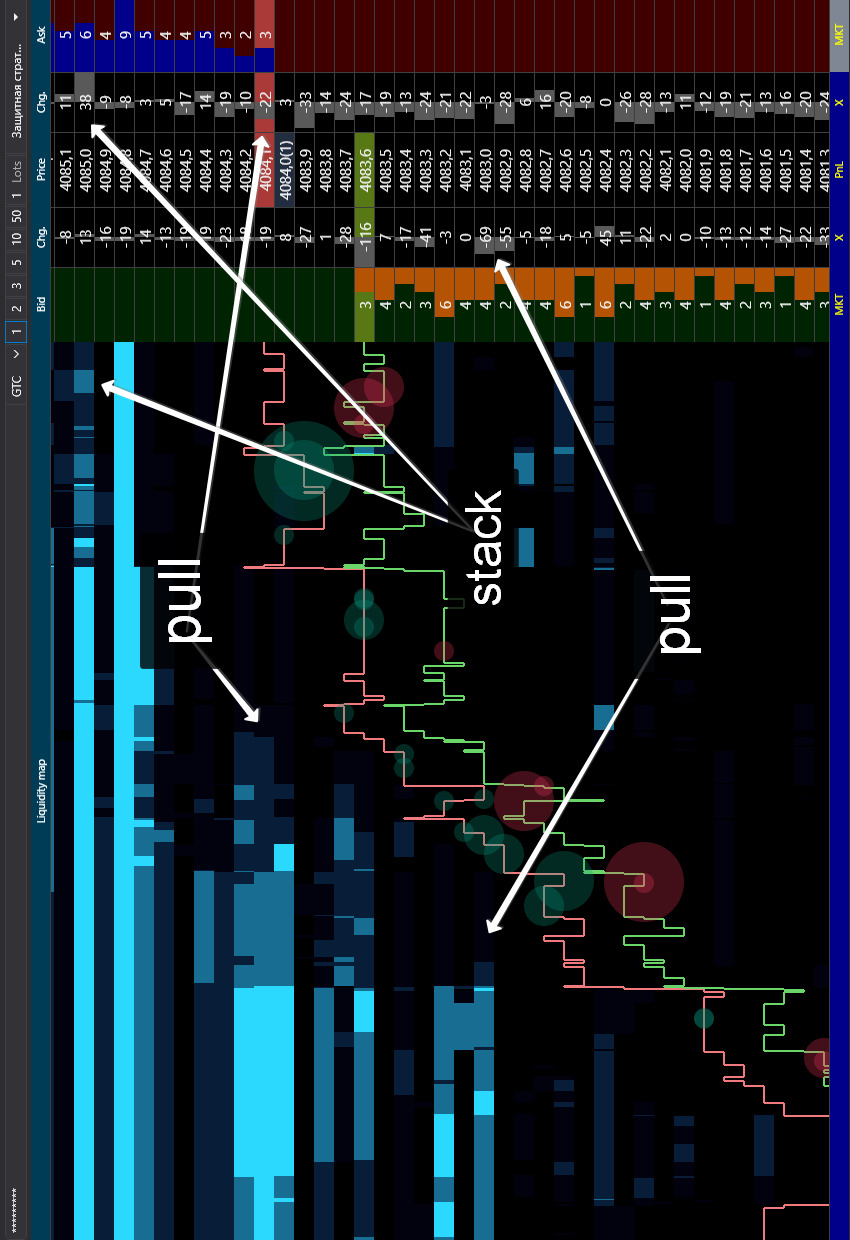
— Pulls / Stacks (rapid cancellations / additions) on L1–L3 → fresh signals of changing intent.
— Interaction with the spread: hits on one side without spread expansion → a sign of aggressor absorption (absorption / refresh).
Trades and Orders
Basic Logic
A trade occurs when an aggressor (a market order or a triggered stop) matches with someone’s limit order in the book (DOM / LOB).
— DOM shows intentions (resting limit orders, depth, queue).
— T&S records execution facts (prints).
1) Market Order
What it does.
Executes immediately at the best available prices until the full size is filled.
When to use.
— Urgent entry/exit (news, breakout, emergency stop, pre-clearing exit).
— Small size in a liquid instrument, when price certainty matters more than fees/impact.
How it appears.
— T&S: a series of prints at Best Ask (buy) or Best Bid (sell); often in bursts.
— DOM: rapid consumption of resting levels; on thin markets the spread may widen.
Pros. Guaranteed and fast execution.
Cons/Risks. Slippage and market impact (especially beyond L1); higher taker fees; on thin books price may sweep several ticks.
2) Limit Order
What it does.
Sets a price you agree to trade at and joins the queue at that level.
When to use.
— Passive entry/exit at a level; fee savings (maker rebates); slippage protection.
— Placing iceberg “steps” for accumulation or distribution.
How it appears.
— DOM: increased volume on your side; formation of a “step” or “wall.”
— T&S: execution only when an aggressor hits your level.
Pros. Price control, possible rebates, lower impact.
Cons/Risks. No execution guarantee; queue risk (you may not get filled), pickup risk (level pulled before touch), partial fills.
3) Stop / Stop-Limit Orders
What they do.
— Stop Market: upon trigger becomes a market order (execution likely, price uncertain).
— Stop Limit: upon trigger becomes a limit order (price control, but fill not guaranteed).
Use cases.
— Protective stops for positions.
— Stop-entries for breakout trades (momentum confirmation).
How it appears.
— T&S: sharp one-directional print series at the trigger level (stop sweep, often with spread expansion).
— DOM: rapid consumption of multiple levels; brief “emptiness” followed by a return → exhaustion sign.
Risks.
— In volatility, Stop Market may cause large slippage.
— Stop-Limit may not fill (price jumps past the limit, no liquidity).
4) Special Order Types
Iceberg
Idea. Only a small visible “cap” is shown; hidden size refreshes after fills.
Where it fits. Accumulation/distribution without advertising size; level defense (aggression absorption).
Signal. Many hits on one side in T&S without price moving; in DOM the visible size persists and refreshes quickly.
Hidden
Idea. Fully invisible in DOM; often lower queue priority versus visible limits.
Where it fits. Stealth entry/exit when not wanting to alert the market.
Signal. Looks like sudden fills “in empty space.”
Pegged
Idea. Price is tied to a reference (Best Bid/Ask or mid) with an offset.
Where it fits. Algo quoting, market making, maintaining ladders without manual re-quoting.
Signal. Frequent auto-repositioning as the reference moves.
5) TIF — Time in Force
— DAY — valid until session end.
— GTC — good till canceled; survives sessions/clearing (“permanent steps”).
— GTD — valid until a specified date/time.
— IOC — fill what’s available immediately, cancel the rest (often not visible in DOM).
— FOK — fill entire size or cancel (precise entries, many rejections).
Practice.
— IOC — probe liquidity without making noise.
— FOK — aggregations/arbitrage where partial fills are unacceptable.
— GTC/GTD — resting levels/steps and “picked on pullback” scenarios.
Common Mistakes
— Using Stop-Limit in high volatility expecting guaranteed protection.
— Advertising large size with a visible limit at an obvious level.
— Ignoring TIF (forgotten GTC orders create “ghost” liquidity).
— Reading DOM without T&S (DOM without tape is half the picture).
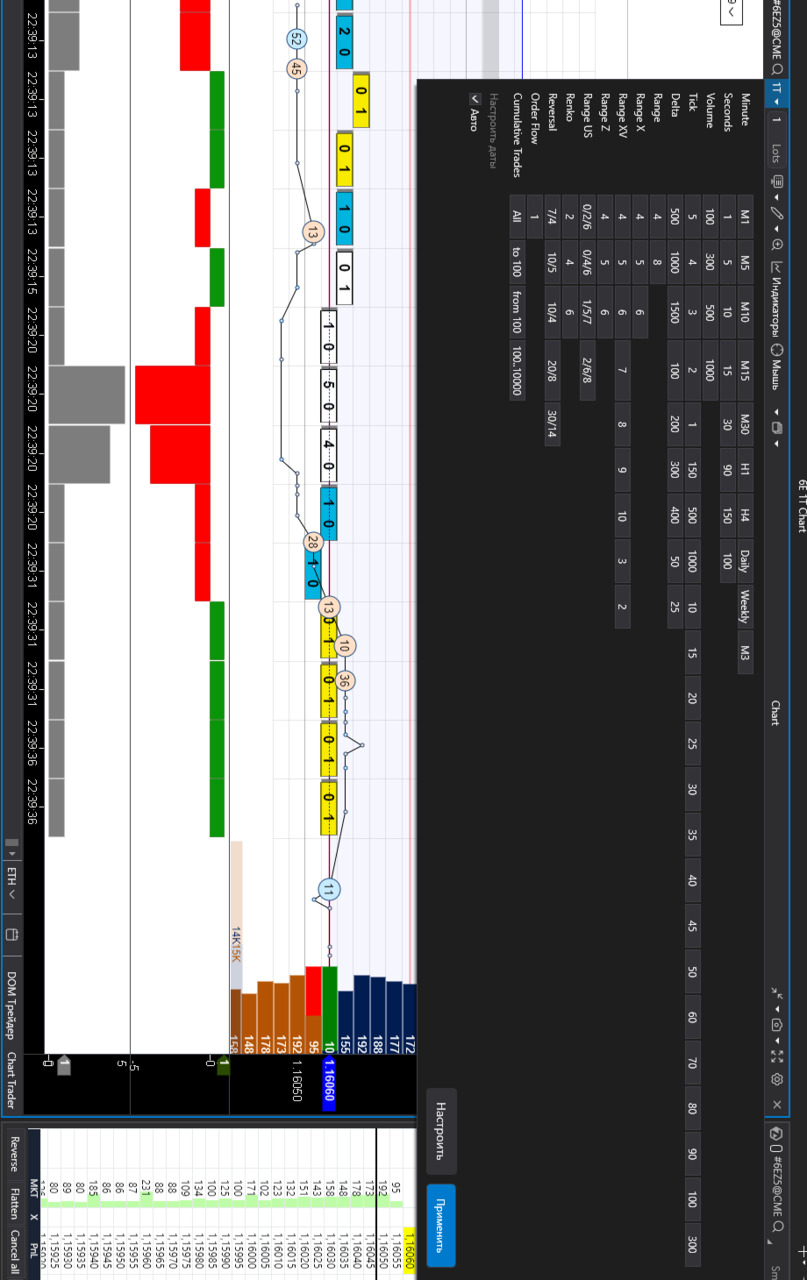
Tick / Bar Charts: Tick / Time / Volume / Δ-Volume
Screen context.
A 1-tick chart is shown; Order Flow (aggregated trades within the bar) overlays it. Below are two indicators: Δ-volume (delta) and Volume. DOM on the right provides liquidity context.
What’s what.
— Tick (1T). Each bar = one trade. Maximum detail without time aggregation; great for detecting aggressor changes and bid-ask bounce.
— Order Flow (bar clusters). Prints aggregated by price/time within the bar; cell numbers = side volumes; color/background shows Bid/Ask hits and distribution.
— Δ-Volume (delta). Buy@Ask — Sell@Bid per bar. Plus/minus shows current aggression; strong delta without price progress → absorption signal.
— Volume. Total participation regardless of side; sleepy areas vs. activity bursts.
Other aggregation methods (for comparison).
— Time bars (1s/1m): good for syncing with news/sessions.
— Volume bars: bar closes after N contracts; normalizes bar “weight.”
— Δ-volume bars: close on delta accumulation; highlight side imbalance.
Practical note.
On fast instruments, 1-tick can be noisy — increase size (e.g., 5T/10T) or switch to Volume/Time bars while keeping Order Flow clusters and the Δ-volume + Volume indicators.
Market Mechanics: Events, Sessions, and Auctions
LOB Events
LOB events are the minimal “atoms” of how the order book operates. Any change in the DOM and any print in T&S is the result of one or more of these events.
1) Add — Order Addition
— What happens: A new limit order joins the queue at a price level.
— How it appears: Volume increases at that price in the DOM, sometimes forming a “step.” Queue position is set by priority (usually FIFO).
— Notes: DAY/GTC affect the “longevity” of steps; pegged and iceberg orders also arrive as add events (visible portion only).
2) Modify — Order Modification
— What happens: An existing order changes price, size, or parameters.
— How it appears: Orders move between levels; partial size increases or decreases.
— Pitfalls: On many exchanges, a price change is effectively cancel + add (queue position is lost). This matters for tactics that try to “reprice without losing the queue.”
3) Cancel — Order Removal
— What happens: An order is partially or fully withdrawn.
— How it appears: Levels “thin out” in the DOM; sometimes rapid pulls at L1–L3 just before a move.
— Signals: Mass, synchronized cancels on the defending side increase the odds of a break; removal of a “wall” often precedes an impulse.
4) Match — Execution (Trade)
— What happens: An aggressor (market/triggered/IOC, etc.) meets a resting limit order from the LOB.
— How it appears: Level volume decreases in the DOM and a line prints in T&S (time/price/size/side). Series of matches without spread expansion can indicate absorption/refresh.
Sessions and Auctions (Impact on DOM/T&S)
Trading Modes
— Pre-open / Pre-market: Orders are accepted, but matching is absent or limited. You see “balancing” — volume accumulation and imbalance shifts.
— Open: The opening auction forms the indicative open price; after the first print the market transitions to continuous trading.
— Intraday (continuous trading): Normal LOB operation (add/modify/cancel/match in real time).
— Close: Closing auction (indicative close price), then clearing.
— Special modes: Volatility auctions/halts, trading pauses, crossing sessions — temporarily switch the market to order accumulation followed by a single match.
Opening/Closing Auctions
— Mechanics: Orders accumulate; the exchange publishes IOP/IOC (indicative open/close price) and imbalance. At auction time, a single large match occurs.
— How it appears: Before the auction, T&S is empty or sparse while the DOM thickens at key prices; at the auction, one or several large prints appear as a block, then normal flow resumes.
— Auction order types: MOO/MOC (market-on-open/close), LOO/LOC (limit-on-open/close), IO orders — participate only in the respective auction.
Time-Based Practical Effects
— Before open/close: Spread and depth behave “abnormally” (often wider/uneven); some liquidity providers filter flow — don’t confuse this with a genuinely thin market.
— During auctions: Large one-off impact and a shift in reference levels are possible; delta/tape signals before the auction are not equivalent to a normal impulse.
Important Nuances for Reading DOM/T&S
— Queue and priority: FIFO vs Pro Rata vs maker-priority/LMM determine who fills first. Changing a limit price often forfeits queue position (modify ≈ cancel + add).
— Latency/aggregation: Data vendors and terminals may aggregate small events; for micro-reading, being able to adjust aggregation is essential.
— Self-trade prevention / cross-match rules: Some opposing orders from the same participant may be canceled or matched specially, affecting tape appearance.
— Regime logic: Trading pauses and volatility corridors alter normal spread/depth dynamics — interpret signals with regime context.
Bottom line: Understanding the four LOB events and the calendar of sessions/auctions explains why DOM/T&S look the way they do — where liquidity is “painted,” where it’s actually taken, and when a “quiet” book is a regime effect rather than participant intent.
Execution Priorities:
Why it matters. Priority determines who gets filled first at the same price level and how fast the queue moves. This directly affects order type selection, TIF, and re-pricing tactics.
1) FIFO (Price – Time, “first come, closer to the front”)
— Rule. Price first; within a level — time of entry. Adding to an existing level puts you at the back; changing price usually loses the queue (modify ≈ cancel + add).
— Implications.
— Visible “walls” are more stable; a large early participant can “hold” a level.
— Tactics: place earlier and don’t fidget; split size into multiple limits so part of it gets closer.
— In DOM/T&S. Slow “chewing” of a level top-down; frequent partial fills for early orders.
2) Pro Rata (proportional)
— Rule. Fills at a level are allocated proportionally to resting sizes (often with minimum quotas and rounding). Variants include pure Pro Rata and Pro Rata with a time tie-break.
— Implications.
— Larger orders receive a bigger share; small ones may “wait forever.”
— Tactics: increase size (or build steps), watch rounding thresholds; re-pricing is penalized less.
— In DOM/T&S. Impact volume is distributed in “chunks” across several participants; less of a single long queue being eaten.
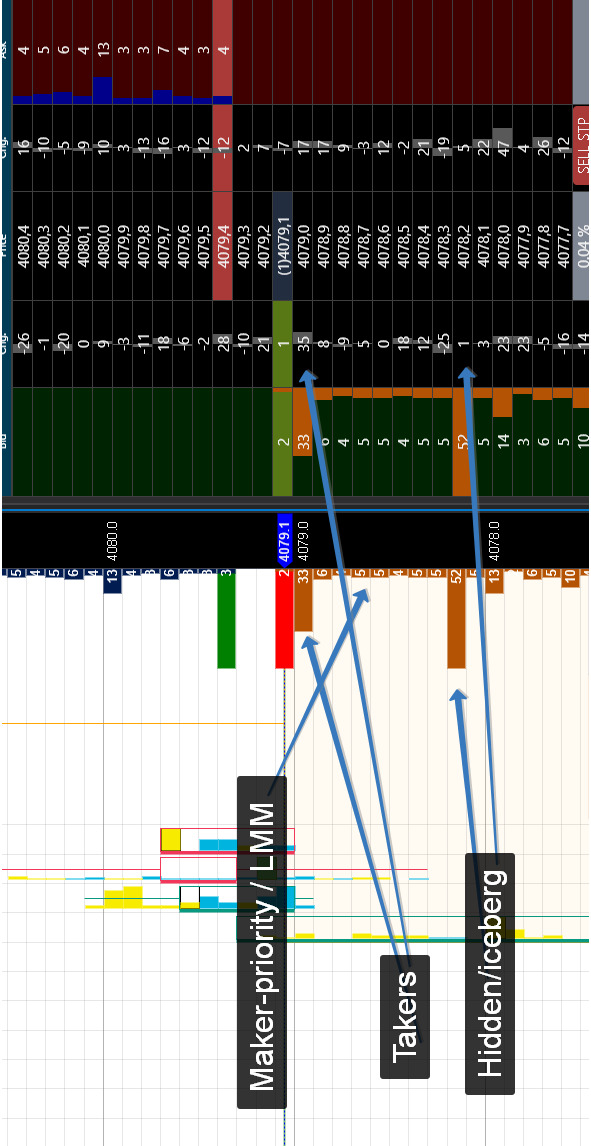
3) Maker-priority / LMM (local market maker)
— Rule. With equal conditions, priority goes to the maker (quote provider) or designated LMM. Sometimes makers receive price/size priority or “match-at-set” privileges.
— Implications.
— A regular participant may lose fills to a maker even at equal price/time.
— Tactics: don’t assume perfect equality; work a tick better (inside), look for time/size niches.
— In DOM/T&S. You’ll often see “someone” getting filled first — even when visible queues look equal.
Practical notes
— Re-pricing = queue loss in FIFO (less critical in Pro Rata). Adding a new step is often better than jumping a single order.
— Size splitting. Helps in FIFO to occupy multiple queue positions; in Pro Rata, consolidation is often better.
— TIF effects. IOC/FOK don’t form long queues and often bypass parts of priority logic (fill or disappear).
— Hybrid rules. Exchanges use hybrids: Price – Time with Pro Rata on some instruments/sessions, or Pro Rata with time tie-breaks. Check the venue spec for your contract.
— Hidden/Iceberg. Hidden orders usually have lower priority at the level; an iceberg’s “tip” ranks like a normal limit — each refresh gets a new timestamp.
You are holding a book about seeing the market from the inside — at the level of orders, queues, and trades. There’s little room here for guesswork or pretty pictures, but a lot of specifics: what exactly happens in the order book, who hits the market, how the balance of power shifts, and why the same volume can produce different outcomes. One simple request: read not to confirm familiar ideas, but to test hypotheses against facts.
Let’s agree on the approach from the start. Every observation in this book is meant to be verifiable: you should be able to reproduce it in your terminal, on the tape, and on the chart. If a rule can’t be rechecked in replay, it’s not a rule — it’s an opinion. Keep your tools ready: DOM/LOB, T&S, tick/volume aggregations, and a trade journal. Pause, slow-motion, rewind — these are your best friends.
Don’t look for “signals forever.” Microstructure changes across instruments and sessions. The same patterns behave differently with other liquidity, tick sizes, and priority algorithms. We deliberately show counterexamples and invalidation conditions — use them to avoid overfitting to two lucky screenshots.
Discipline matters more than talent. Limit risk to a size that lets you stay objective; trade small until you can reproduce results; separate execution from evaluation — follow the plan first, analyze mistakes later. Above all, respect the market: it doesn’t owe us confirmation of our expectations, and that’s exactly what makes the craft of trading interesting.
If you’re ready to see price movement not as a sequence of candles but as a chain of human and machine decisions, this book will repay your time. Open the terminal, turn on replay, and verify every idea with your own eyes. Let the following pages become tools, not decorations.
.
Market Data Analysis Platform

Basic Workspace Templates for the Analysis Platform

.
Chapter 1 ● Glass Mechanics
In this chapter, we descend into the “engine” of price — the Limit Order Book (LOB). This is where the best Bid/Ask quotes are formed, the spread is born, the mid price is calculated, and the minimum step of movement is measured in ticks. We will examine not only what is visible in the DOM, but also how it actually works: how orders enter the queue, under which rules they are executed, and why the same volume can produce different price outcomes.
Next, we will study market depth and its asymmetries, the recognition of “walls” and “ladders” (stacked liquidity), as well as the dynamics of additions and cancellations that set the tone for the next move. We will conclude with the key tool of the chapter — the queue imbalance across levels (L1–L10) and microprice as an estimate of the subtle tilt of the “market scales” between buyers and sellers.
The practical goal of this chapter is to learn how to read the DOM quantitatively: to distinguish displayed liquidity from real liquidity, to understand where you are in the queue and how fast it moves, and to turn local imbalances into concrete decisions — enter / hold / cancel.
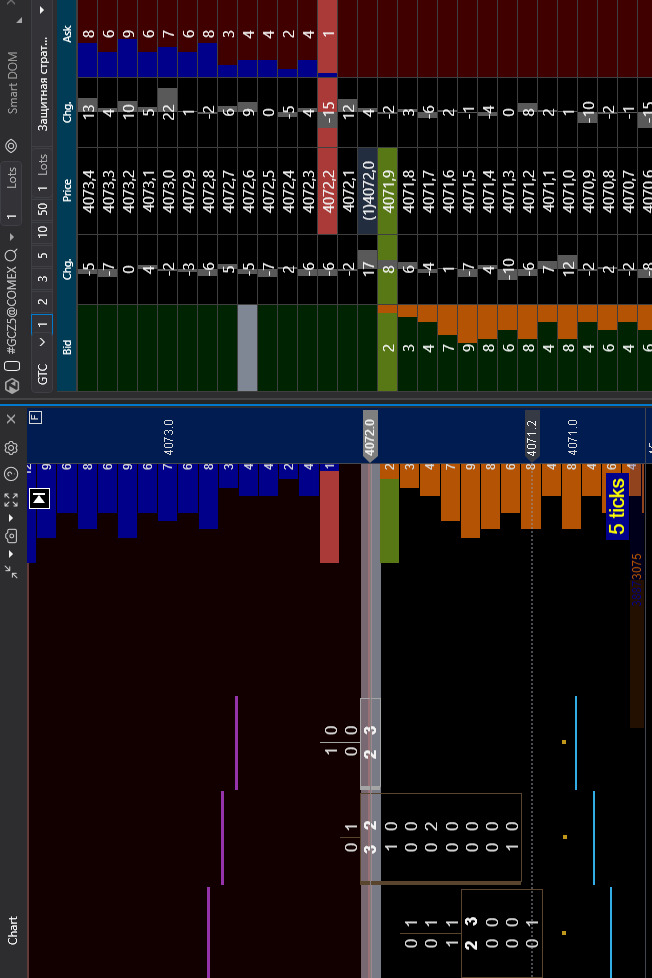
Quotation Book (Bid/Ask), Spread, Mid, Price Tick
In the illustration: on the left, a 10-tick chart with a footprint and an overlaid DOM; on the right, a Smart DOM with limit orders and columns showing changes.
A) Bid/Ask and the Price Ladder
Price ladder. A vertical price scale with a discrete step (tick size). Each row is a possible execution level. The ladder defines the “grid” along which price can move: not by half a tick and not “in between” — only in multiples of the tick.
Best Bid (L1 Bid). The highest price buyers are currently willing to pay. This is the edge of the buy queue: if someone sells at market, execution starts here. The thicker the volume at L1 Bid, the larger the downside “cushion” — but only until it is pulled or consumed.
Best Ask (L1 Ask). The lowest price sellers are willing to accept. Any market buy will start matching here. Watch how often L1 Ask refreshes after hits — this hints at iceberg/absorption.
L2…Ln — depth. Subsequent levels on both sides. They form the near-term context: where “ladders” (repeating volume blocks) sit, where gaps appear, and where liquidity thins. Cumulative depth over the nearest 3–5 levels gives a sense of the local “heaviness” of price.
Level queue. At each level, limit orders line up according to exchange rules (often FIFO: price – time). First in, first filled. Change the price and you usually lose your place (modification = cancel + add). Hence the tactic: if queue position matters, avoid frequent changes; split size across multiple orders.
How this shows up in data
— Aggressive buying → matches occur on the Ask; volume at that level in the DOM decreases; the footprint prints “at Ask.”
— Aggressive selling → matches on the Bid; the tape shows “at Bid” prints.
— If a series of buys occurs while the Ask holds and the spread doesn’t widen → likely refresh/absorption. If, at the same time, upper levels are being pulled → prepare for an upside “poke.”
B) Spread and Mid
Spread = Ask₁ — Bid₁. The minimum gap between best quotes. On liquid contracts it often stays at 1 tick, but can instantly widen if:
— limits are pulled,
— the market receives a burst of aggression (market/stop flow),
— liquidity drops (session transitions, pauses, news).
Mid = (Bid₁ + Ask₁) /2. A convenient axis of short-term equilibrium. Relative to mid, bias is easy to see: persistent trading above → buyer dominance; below → seller dominance. Many pegged orders follow the mid, hence frequent micro-rearrangements at L1.
Reading spread dynamics
— Tightening to 1 tick with stable depth → a “dense” market, low entry costs; easier to build with limits.
— Choppy/wide spread (2–3 ticks or more) → thin book: expect more slippage; split size or switch to algorithmic execution.
— Tightening during buying without price movement → absorption: the Ask takes hits and refreshes.
— Widening with a print series → likely level break: limits leave, the aggressor probes the ladder.
Execution implications
— Narrow spread favors passive limits (maker rebates, lower impact).
— Wide spread favors small IOC/market slices; otherwise price control is lost.
— “1-tick stop” plans on variable-spread instruments are unrealistic: the stop can trigger on spread breathing alone.
Common mistakes
— Judging “side strength” from a single spread change while ignoring the tape.
— Confusing temporary news/auction widening with true liquidity weakness.
— Forgetting that mid can move without prints due to L1 reshuffling, not real flow.
C) Tick Size and Tick Value
Tick size. The minimum price increment. Price moves only in multiples of this step (discrete ladder). Examples: 0.25, 0.1, 0.005—instrument/exchange specific.
Tick value. The monetary value of one tick per contract, set by the contract spec (multiplier).
Examples
— Step = 0.25, multiplier = $50/point → 1 tick = 0.25 × $50 = $12.50.
— Step = 0.005, multiplier = €125,000/point → 1 tick = 0.005 × €125,000 = €625.
Why it matters
— Risk planning. Stops/targets in ticks; capital in money via tick value.
— Risk ($) = stop ticks × tick value × contracts.
— Setup realism. If average “breathing” noise is 2–3 ticks, a 1-tick stop will be hit statistically.
— Instrument comparison. Same tick size can mean different tick value → different cost of the same move.
— Commissions and spread. Minimum entry cost ≈ spread (ticks) × tick value + commission. With a 1-tick spread, entry “costs” one tick (ex-commissions).
Practical rules
— Stop <average intrabar noise (ticks) → near-certain stop-out.
— Targets <2× spread rarely cover commissions/impact on fast instruments.
— Switching contracts? Recalculate tick value — same ticks yield different P&L.
Common mistakes
— Assuming “1 tick = little money” without the multiplier — some futures have expensive ticks.
— Copying stops/targets between instruments unchanged.
— Ignoring that with a wide spread, initial drawdown already equals ≥1 tick before the first favorable print.
D) DOM Columns and Change Columns
Bid / Ask. Visible limit liquidity by price level. Thick numbers/bars are “walls”; thin ones are gaps. Remember: these are intentions, not trades; they can vanish (pull) in milliseconds.
Price. Tick-sized price scale. Read relative positioning: L1 (best), L2–Ln (depth). Jumps between rows without tape prints are usually limit reshuffles, not real trading.
Chg (Change). Volume change at a level since the previous update:
— Plus → stack (limits added; level strengthened).
— Minus → pull (limits removed; level weakened).
— Series of pulls on the defending side alongside aggressor prints there → strong signal the level may give way. Series of stacks often precede stalling or absorption.
Ord / Queue (if enabled). Number of orders/queue position — useful for limit tactics:
— FIFO: early placement matters (don’t “twitch” the price or you lose priority).
— Pro Rata: larger size helps participation; time priority matters less.
What this adds to DOM reading
— Pulls on L1–L3 + one-directional T&S prints → the level likely yields (liquidity flees).
— Stacks on L1–L2 with steady prints and a non-widening spread → absorption/refresh (the level is defended).
— Bid/Ask imbalance across L1–L5 with Chg spikes on one side → short-term depth imbalance (entry/cancel context).
Frequent errors
— Treating any large Bid/Ask as an immovable wall — check Chg and tape; it may be “painted.”
— Reading a disappearing level as a reversal — often it’s just a cancel+add higher/lower.
— Ignoring the queue: a limit at the tail of an active level may not fill despite big displayed size.
E) Footprint and Overlaid DOM
Footprint. Shows actual execution by price within each bar: how much traded on Bid vs Ask, micro-series of prints, volume distribution by level. It’s the X-ray of trades — facts, not intentions.
Overlaid DOM. Displays visible liquidity (limits) at the same price levels directly on the chart, letting you see where orders stood and where aggression hit.
Reading them together
— Absorption / refresh. Many Ask prints with a steady L1 Ask and no spread widening → the offer absorbs buyers (iceberg/refresh). Same for Bid.
— Thin pass (level poke). Fast pulls on Ask L1–L2 + a buy series in the footprint → high odds of an upside probe (the ladder empties). Mirror for Bid.
— “Noise without progress.” High Ask delta in the footprint but no price advance and Ask doesn’t move → seller accumulation; often precedes a pullback.
— Quiet progress. Modest Ask volumes with steady upward stepping and rare seller pulls → thin advance without resistance.
Practical notes
— Compare cluster volumes to DOM changes. A large Ask cluster + zero/positive Chg on Ask L1 is a strong absorption signal.
— Mind tape aggregation: with clustering on, “packages” look larger — don’t assume a single participant.
— Context beats a single bar: check 2–3 neighbors; persistence matters more than a spike.
F) Mini-Metrics
Top-5 depth (by side). Cumulative visible liquidity at L1–L5 on Bid and Ask — near-term “weight”:
— High Top-5 on the sell side with average demand → likely overhead cap.
— Symmetrically, high Bid Top-5 → downside cushion.
— Watch the rate of change (how fast it melts/builds every 1–3 seconds) — more important than a static snapshot.
ΔDepth = ΣBid (L1–L5) — ΣAsk (L1–L5). A coarse local book imbalance:
— ΔDepth> 0 → near zone heavier below (relative buyer advantage).
— ΔDepth <0 → seller advantage.
— Significance depends on the instrument: use historical σ of ΔDepth for your timeframe; signal when |Δ| exceeds ~1–1.5σ and persists for 2–3 updates.
Spread state {tight/normal/wide}. Classify spread in ticks to gauge expected slippage and execution mode:
— Tight: = 1 tick (or historical minimum). Easier limit entries, lower impact — good for “thin” entries/adds.
— Normal: typical for the session — balance limits with partial IOC.
— Wide: ≥ 2–3 ticks or above historical median +1σ. Expect more slippage; split size, prefer algos (IOC/FOK/TWAP) or delay entry.
Putting it together
— If ΔDepth ≫ 0, spread tight, and Bid Top-5 stays high → passive buys (limits) make sense with a short stop beyond the nearest depth “kink.”
— If ΔDepth ≪ 0, spread wide, Ask Top-5 building, and the tape shows serial sells → aggressive buying is unattractive; wait for pullback/absorption.
— A sharp ΔDepth shift with simultaneous spread widening → liquidity sweep; assess thin-pass risk and avoid 1–2 tick stops.
Notes
— Metrics see only visible liquidity; icebergs/hidden orders can distort — confirm with the tape.
— Track trends, not single values (3–5 updates): persistence signals, single spikes are noise.
— Normalize by time of day/session: nights are thinner; signal thresholds should be softer.
Summary
— The order book is a map of intentions (Bid/Ask, depth, queue). The tape/footprint are execution facts (who hits, where, and at what pace).
— Spread, mid, and tick size define the working price grid where stacks/pulls, queue speed, and local imbalances are read.
— DOM provides context (depth, level changes), T&S shows aggression and tempo, footprint shows intrabar print distribution.
— Chain signals as: context → trigger → confirmation → cancellation.
Coordinated reading of these three sources enables better micro-horizon decisions — entry/hold/cancel — while improving control of risk, impact, and slippage.
Request queue and execution priorities
In the Limit Order Book (LOB), each price level contains a queue of limit orders. This is a living queue: some orders arrive, others change parameters, others are canceled, and still others are executed when the opposite side “hits” them. Below is how this works and how it appears on screen in the DOM (order book) and in T&S (time & sales).
Four basic order actions
• Add — a new limit order appears at a specific price level.
In the DOM, the number of lots at that level increases. Nothing appears in T&S because no trade has occurred yet.
• Modify — an order is adjusted: price and/or size is changed, or its “time-in-force” is extended.
This may look like the order disappeared at one level and appeared at another (many exchanges treat a price change as “cancel + add,” i.e., a loss of queue position). In the DOM this shows as volume shifting between levels; T&S remains empty (no trade).
• Cancel — an order is partially or fully removed from the queue.
In the DOM, volume at the level decreases without any corresponding prints in T&S. If numbers thin quickly across several nearby levels at once, these are mass cancellations (pulls).
• Match (execution) — an aggressive order arrives (market order or triggered stop) and meets a limit order.
In the DOM, volume at the level decreases; in T&S a trade line appears (time, price, size, side — at Bid or at Ask). Multiple consecutive lines form an execution “burst.”
In short: the DOM shows intentions (add/modify/cancel), while T&S shows execution facts (matches).
Why this matters for understanding the queue
— Dozens of orders from different participants can sit at the same level. Execution order depends on priority rules (e.g., “first in — first out”).
— The speed at which the queue “moves” depends on two flows:
— how much aggression arrives (how many trades print in T&S at that level),
— how fast limit orders are canceled/added (seen in the DOM as volume changes).
— If volume disappears from the DOM with no trades in T&S, the level was canceled, not “eaten.”
— If trades print in T&S while volume at the level keeps replenishing, someone is absorbing the flow (often an iceberg/level refresh).
This grounded view — what exactly happened: added, modified, canceled, or executed — is the foundation for reading the queue and participant behavior without guesswork.
A) How the queue works at a level
Unit of observation: a price level (a row in the DOM). At any moment, dozens or even hundreds of limit orders from different participants sit there. It’s a living queue: orders are added, canceled, or executed.
Queue position (“who is closer to the cashier”)
— Determined by the exchange’s priority rules. In the classic FIFO (price – time) model, whoever placed the limit order earlier gets filled first.
— If a participant changes price, many exchanges treat it as cancel + add → the order loses its place in the queue.
How aggression “eats” the queue
— When an aggressive order arrives (market buy/sell, triggered stop, or IOC), it matches with the first limit order in the queue on the relevant side (Ask for buys, Bid for sells).
— The earliest limit order fills first, then the next one — the level is “eaten from the top” until the aggressive size is exhausted or the next price is reached.
Partial fills
— A large limit order can be filled in pieces: part of the size is executed, and the remainder stays in its place in the queue (it is not pushed back).
— In the DOM this appears as a gradual decrease in volume at the level; in T&S as multiple trade lines at the same price.
Queue speed (why it’s sometimes fast and sometimes “sticky”)
Two flows determine it:
— Matches — how much and how fast aggression hits (trade series in T&S at that level).
— Limit changes (pull/stack) — how quickly orders are canceled (pull = volume decreases without trades) and how quickly new orders are added (stack = volume increases without trades).
Simply put: many trades and few cancellations → the queue advances quickly; few trades and many cancellations → the level “melts” and runs away from the hit.
What you see in the data
— In the DOM: volume decreases on execution, increases on adds, and decreases without trades on cancellations.
— In T&S: each line is a trade (time, price, size). A series of lines at one price means the queue is truly being consumed by aggression.
— If DOM volume shrinks while T&S shows few or no prints, it was a limit outflow (cancellations), not real buying/selling at that price — traders say the level “ran away from the hit.”
Mini example (Ask side)
— Ask L1 shows 500 lots. An aggressive buyer for 300 lots arrives.
— — T&S prints a series of trades at the Ask; in the DOM Ask L1 drops from 500 → ~200.
— Next, several participants cancel orders (fearing continuation).
— — In the DOM Ask L1 falls from ~200 → 120, with no new trades in T&S — these are cancellations, not new buys.
— Another participant refreshes the level (adds an iceberg “cap”).
— — In the DOM Ask L1 rises from 120 → 180 without trades — this is an add (stack/refresh).
This perspective lets you distinguish what was truly consumed by aggression, what was pulled manually, and who is replenishing the level — revealing the live mechanics of the queue rather than just a static number in the book.
B) Roles and typical behavior of participants in the queue
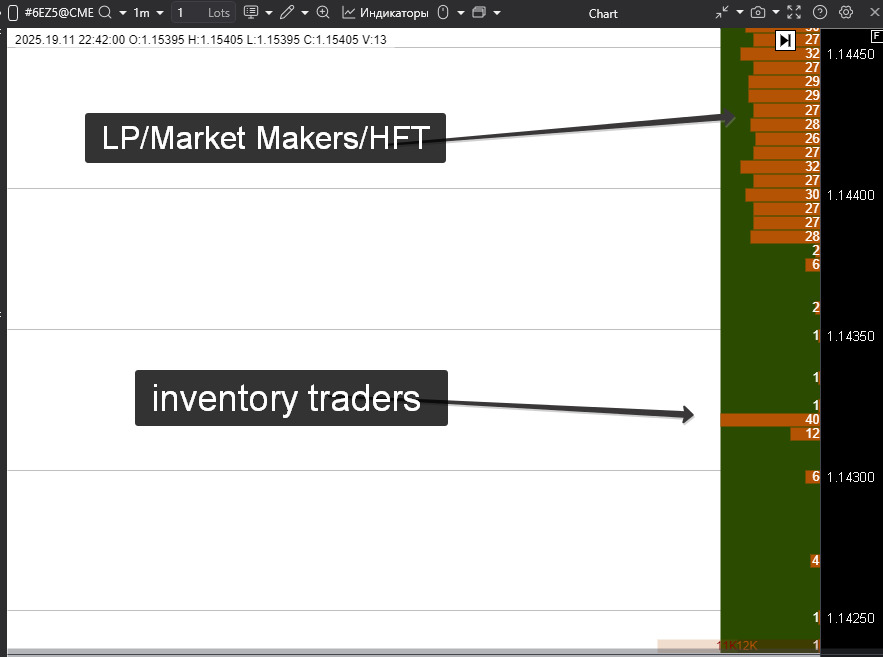
1) Liquidity providers (LPs / market makers / HFTs)
What they do.
They keep the market “smooth”: continuously place limit orders near the best prices (L1) and rapidly re-price them at the slightest change in balance.
Why.
They earn the spread and rebates (fees for providing liquidity) and try to avoid adverse selection — being picked off right before a sharp move.
How it looks:
— DOM: frequent refreshes near L1—volume disappears and reappears in the same “chunks.”
— T&S: when strong aggression shows up, they synchronously pull the first steps (pulls at L1–L2) to avoid getting caught in the impulse.
— Visual tell: “blinking” levels near price and rapid re-positioning — typical LP algorithms.
2) Inventory traders and funds (holding a position/defending a level)
What they do.
Place large limit sizes at preselected levels (support/resistance), sometimes as a “ladder” — stepped across several prices.
Why.
Either to build/unwind a position with minimal price impact, or to defend a level that matters to them.
How it looks:
— DOM: visible “steps” or “walls” (stacked liquidity) — notable blocks of size across consecutive prices.
— T&S: when the level is hit, you often see partial replenishment (iceberg/refresh) rather than a single huge visible order.
— Visual tell: the level “holds” through a series of prints without the spread widening — price seems to lean on it while volume at the level self-replenishes.
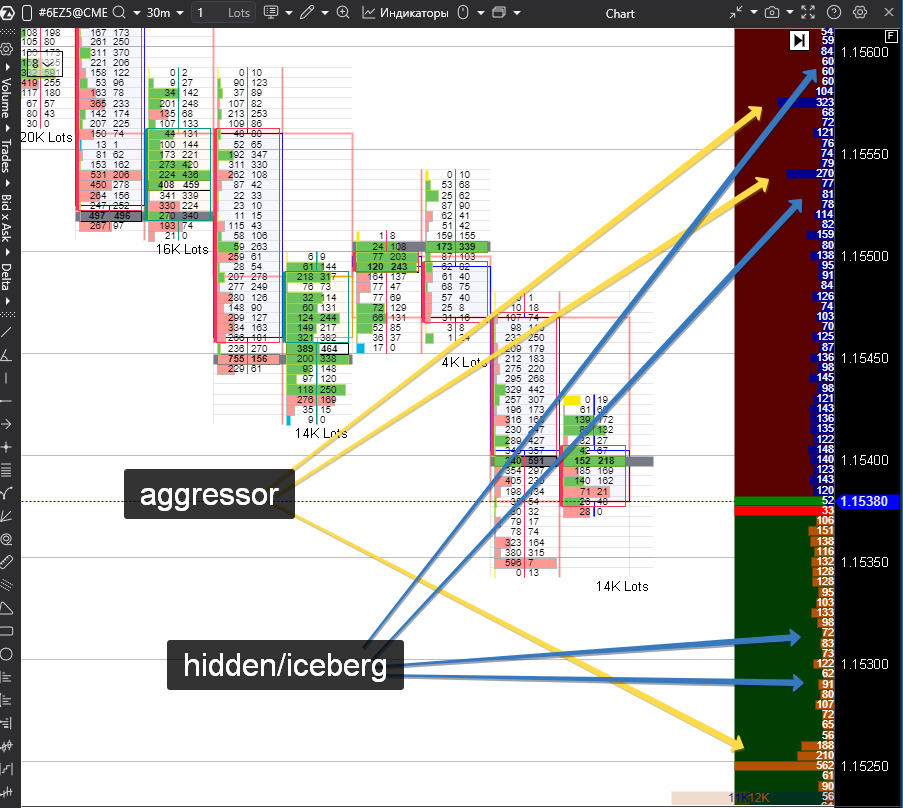
3) Aggressors (taker algos, stop flows, arbitrage)
Aggressors are participants who initiate trades, hitting resting limit orders “through the market.” Speed of execution matters more to them than getting the perfect price. In tape terms, these are takers (market/triggered orders, IOC/FOK).
What they do.
They go “through the market”: first they probe liquidity with a small size (a market/IOC ping), then they hit with the main size.
Why.
They need fast execution and level traversal — for example, to enter on momentum, reduce risk, or complete an arbitrage.
How it looks:
— T&S: a series of rapid prints in one direction (on the Ask = buying, on the Bid = selling).
— DOM: defensive levels thin out (pulls), the spread often widens; when the “ladder” empties, the aggressor sweeps several ticks at once.
— Visual tell: a one-directional “volley” of trades and fading nearby steps with little visible replenishment.
Who can be an aggressor
— Algo takers: momentum/arbitrage/news; they IOC-ping first, then scale the hit.
— Stop flows: triggered stops convert into one-sided market flow.
— Liquidations/margin calls: forced position closures.
— Manual traders/funds: urgent entry/exit (risk limits, deadlines, rebalancing).
Why they hit aggressively
— Lock in price now (avoid missing entry/exit).
— Break a level / ignite a move (impulse, breakout).
— Close an arbitrage (temporary quote/spread dislocations).
— Execute a forced action (stops/liquidations).
How aggressors appear in the data
— T&S (tape): one-sided print streaks:
— — on the Ask → buying aggressor;
— — on the Bid → selling aggressor.
— Often seen as clustered “volleys,” sometimes with repeating sizes (algo signature).
— DOM: the defending side thins at L1–L3 (pulls), the spread often widens; with an emptying ladder, price sweeps multiple ticks in sequence.
Typical sequences
— IOC ping → size hit. Small liquidity test, then a series of larger prints.
— Stop cascade. Price tags stop levels → avalanche of one-sided trades → brief multi-tick sweep.
— Arb sweep. Fast removal of visible steps without prolonged battle, then stabilization near the new price.
What stops an aggressor
— Absorption/refresh. An iceberg sits at the level: trades print, but price doesn’t move and the spread doesn’t widen.
— Counter-pressure. After sweeping a few ticks, dense opposing liquidity appears and price snaps back (exhaustion).
Risks for aggressors
— Impact and slippage: the thinner the book, the more expensive the hit.
— False breakouts: price quickly returns after stops are cleared.
— Intent leakage: predictable size sequences can be detected by counterparties.
How to spot them “at a glance”
— Tape: rhythmic one-sided print series, sometimes with increasing size.
— DOM: synchronous pulls of nearby defensive levels and spread expansion.
— After the hit: either continued sliding along an empty ladder, or stalling at a level (ran into absorption).
In short: an aggressor pays for speed. Their footprint is a stream of one-directional prints in T&S and “melting” steps in the DOM.
4) Hidden players (hidden / iceberg)
What they do.
They conceal true size. Hidden orders are completely invisible in the book; icebergs show only a small “tip” and replenish it upon execution.
Why.
To avoid signaling large interest and spooking the market; to work against aggression without revealing full size.
How it looks:
— T&S: prolonged absorption at one level — prints keep coming, price holds, and the spread doesn’t widen.
— DOM: visible size is small, yet after print streaks it reappears (refresh), as if the level has “a second wind.”
— Visual tell: a visually “thin” level inexplicably holds heavy flow — often an iceberg.
How the roles interact
— LPs create a thin liquidity “crust” at L1 and quickly step aside when they sense aggressor impulse.
— Inventory players build a deeper “skeleton” of steps, sometimes absorbing flow via icebergs.
— Aggressors test the crust and, seeing pulls, escalate to sweep several prices.
— Hidden players mask true depth, so the tape may show strong flow without price movement.
What they are
— Hidden: fully invisible order; size is not displayed but can suddenly execute when hit. Often lower priority than visible limits at the same price.
— Iceberg: only a small visible tip; when the tip is filled, it automatically refreshes with another small slice.
Why they use them
— Avoid revealing intent/size (no front-running).
— Reduce impact by gradually building/unwinding size.
— Defend a level without advertising a huge visible wall.
How this appears in data
— T&S: extended one-directional execution at a single price; trades print, spread stays tight, price barely moves — someone is absorbing.
— DOM: modest visible size that repeatedly returns to similar values (iceberg); with hidden orders it may look like “no level” until executions suddenly appear.
— Behavioral markers:
— repeating identical tips (e.g., 20 → 0 → 20 → 0) — classic iceberg refresh;
— no spread expansion despite heavy trade flow — absorption by hidden size.
Typical scenarios
— Seller accumulation on the Ask. Buyer keeps hitting the Ask; prints pile up, Ask holds and refreshes — an iceberg/hidden sits on the Ask.
— Bid defense. Sales slam into the Bid, but price doesn’t break — hidden size is holding the Bid.
— False break and return. After a brief sweep, price returns to the same level — hidden player continues absorbing.
Observed tactics
— Split execution into many small trades instead of one large print.
— Keep the visible tip minimally noticeable to avoid attracting aggression.
— Re-price when momentum turns clearly adverse (to avoid being overrun).
Risks and limits
— Adverse selection: strong momentum can still punch through an iceberg, forcing worse fills on the remainder.
— Lower priority for hidden: at equal prices, fills may come after visible limits.
— Pattern detectability: experienced participants recognize refresh behavior and adjust aggression.
Common misconceptions
— “If there’s little size in the DOM, the level doesn’t exist.” False — hidden orders can make a level much thicker than it appears. Check the tape.
— “A big wall always means defense.” Often the opposite: a small visible tip plus sustained absorption is a more reliable sign of real support/resistance.
In short: hidden/iceberg orders let you be large while staying invisible. Their footprint is prolonged single-level execution in T&S with a stable level in the DOM and no spread expansion.
That’s why DOM and T&S must be read together: the book shows who and where is standing, while the tape shows who is actually hitting and who is absorbing.
C) Execution Priority: How “Who Goes First” Is Decided
Priority is the rule by which an exchange decides whose limit order is filled first when aggression hits a price level. It shapes participants’ tactics and how the queue appears in DOM/T&S.
1) FIFO (price – time)
Logic (plain language).
First, price is compared: the better bid/ask is closer to execution.
If the price is the same, the order that was placed earlier is filled first.
Change the price — and in most cases you’re treated as canceled and re-added → you lose your place.
How participants behave.
— Try to get in early and avoid moving the order unnecessarily.
— Often split size across multiple limit orders (so part of it sits closer to the front).
— Move price only when clearly necessary, aware of the risk of falling to the back of the queue.
How it looks in the data.
— In T&S, you see series of prints at one level; in DOM, size decreases smoothly — as if a long “sausage” of orders is being chewed through.
— After a “modify,” size may vanish at one price and reappear at a neighboring tick — effectively cancel+add and loss of queue position.
2) Pro Rata (proportional)
Logic.
When aggression hits a level, the exchange allocates fills proportionally to the sizes of resting limit orders (often with minimum quotas and rounding). A time tie-break may apply if proportions are equal.
How participants behave.
— Increase order size (or consolidate orders) to secure a larger share of fills.
— Less sensitive to placement time: size matters more than “who was first.”
— Watch rounding thresholds: adding a few lots can yield a disproportionately larger allocation.
How it looks in the data.
— On impact, T&S often shows a batch of fills split into “chunks” among several counterparties.
— In DOM, size may drop in steps rather than continuously — reflecting the allocation.
3) Maker Priority / LMM (Local Market Maker)
Logic.
All else equal, priority goes to the maker (liquidity provider) or an exchange-designated LMM. They may be allowed to match slightly earlier, or receive priority when price and time are equal.
How participants behave.
— Non-makers often need to step one tick better (sometimes inside the spread if midpoint/pegged orders are allowed), or look for time/size “windows” where competing with the maker is harder.
— Makers actively refresh quotes and maintain presence to preserve the privilege.
How it looks in the data.
— It feels like “someone” consistently gets filled first under equal conditions.
— Near L1, quotes often “blink” rapidly — a sign of maker quote maintenance.
Hybrid regimes (why the picture doesn’t always add up)
In practice, exchanges frequently use mixed rules:
— Price – time with a size tie-break,
— Pro Rata with a time tie-break,
— Maker priority layered over FIFO/Pro Rata,
— Separate regimes for auctions or volatility halts.
Practical takeaway.
Even if the DOM looks identical, execution outcomes can differ: one participant may consistently get filled first due to hidden tie-breaks or maker status. That’s normal for a given venue and instrument.
Quick visual cues by priority type
— FIFO: a long “sausage” of orders at a level; smooth top-down consumption; high sensitivity to price changes (queue loss).
— Pro Rata: fills distributed to multiple parties at once; order size strongly affects share; repositioning hurts less.
— Maker/LMM: frequent quote refreshes near the best price, and “someone” always ahead under equal conditions.
Understanding priority explains why some levels “hold” while others “give way,” and why the same execution tactic yields different results across markets.
D) How add / modify / cancel / match Change the Queue
These are the four basic actions applied to limit orders. Below is a plain-language explanation of what happens, how it appears in the order book (DOM) and the tape (T&S), and what it means for queue position.
1) add — a new limit order is placed
— What happens: a fresh order appears at the level; the level becomes “heavier.”
— How it looks: in the DOM, size at that price increases (often marked as a stack or positive change). Nothing prints in T&S because no trade occurred.
— Queue meaning: the new order joins the back of the queue at that level (under FIFO). If, after a series of trades, size grows again, this is a refresh (the level is being replenished; often a sign of an iceberg).
2) modify — an existing limit order is changed
— What happens: the participant changes the price and/or size of an order.
— How it looks: most often it appears as “size decreased at one price and increased at a neighboring price,” with no trades in T&S.
— Queue meaning: on many exchanges, a price change equals cancel+add, meaning you lose your queue position (in FIFO you fall to the back). Frequent price “twitching” therefore worsens fill probability.
3) cancel — a limit order is fully or partially removed
— What happens: the order is withdrawn from the level, entirely or in part.
— How it looks: in the DOM, size decreases without trades (negative change = pull). T&S remains empty.
— Queue meaning: the level becomes thinner. Synchronous pulls on L1–L3 on the defending side often foreshadow a pass-through: liquidity is “running away” from an incoming hit.
4) match — a trade (execution) occurs
— What happens: an aggressive order arrives and consumes the front of the queue at that level.
— How it looks: DOM size drops, and T&S prints trades (time, price, size, Bid/Ask side).
— Queue meaning: the queue advances — earlier orders are filled. Many matches at one level with a stable spread often indicate absorption/refresh: someone is taking the flow and replenishing the level.
A short “timeline” of one level (Ask side example)
— add: Ask L1 grows from 180 → 230 lots (no trades) — liquidity is added.
— match: buying begins; T&S prints Ask trades, DOM falls 230 → 140.
— add/refresh: a second later Ask is back to ~200 — the level is replenished (possible iceberg).
— cancel: ahead of a new impulse Ask suddenly drops 200 → 90 with no prints — mass pull.
— match: a burst of buys arrives, the level is pierced, price moves one tick higher.
This cycle is the queue’s “breathing”: add → cancel → match → refresh. By reading which action dominates at the moment (stacks, pulls, or matches), you can tell who is in control: those standing and absorbing flow, or those hitting and pushing the level through.
E) The Queue “in Motion”: Observable Effects
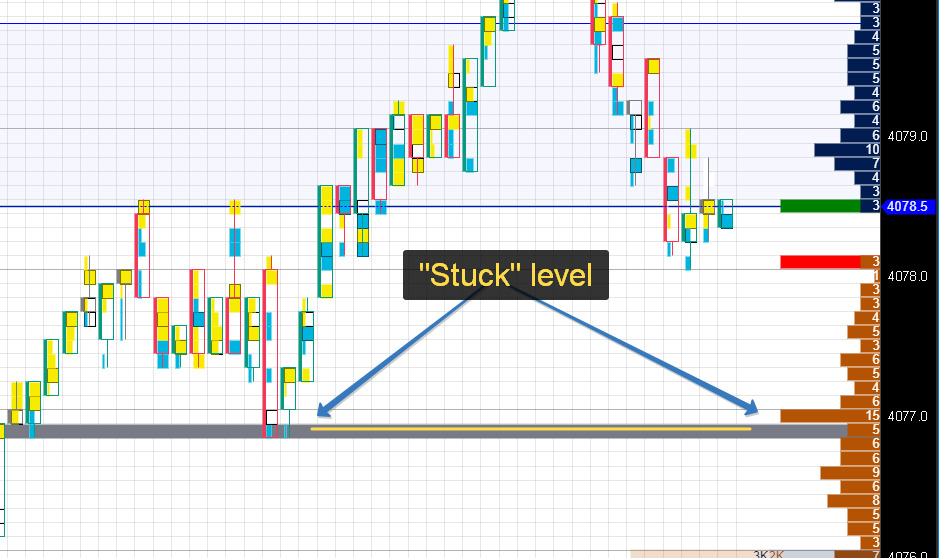
1) Level “sticking” (stalling)
Essence. Long series of trades go through at one price, yet the level does not move.
Signs:
— T&S: many consecutive prints at the Ask (for buying) or at the Bid (for selling).
— DOM: size at L1 decreases and immediately restores (refresh); the spread does not widen.
What it means. A participant with hidden/iceberg volume is standing at the level and absorbing aggression.
Context / risks. Prolonged stalling often ends either with a level break once the hidden volume is exhausted, or with a reversal if the aggressor runs out of steam.
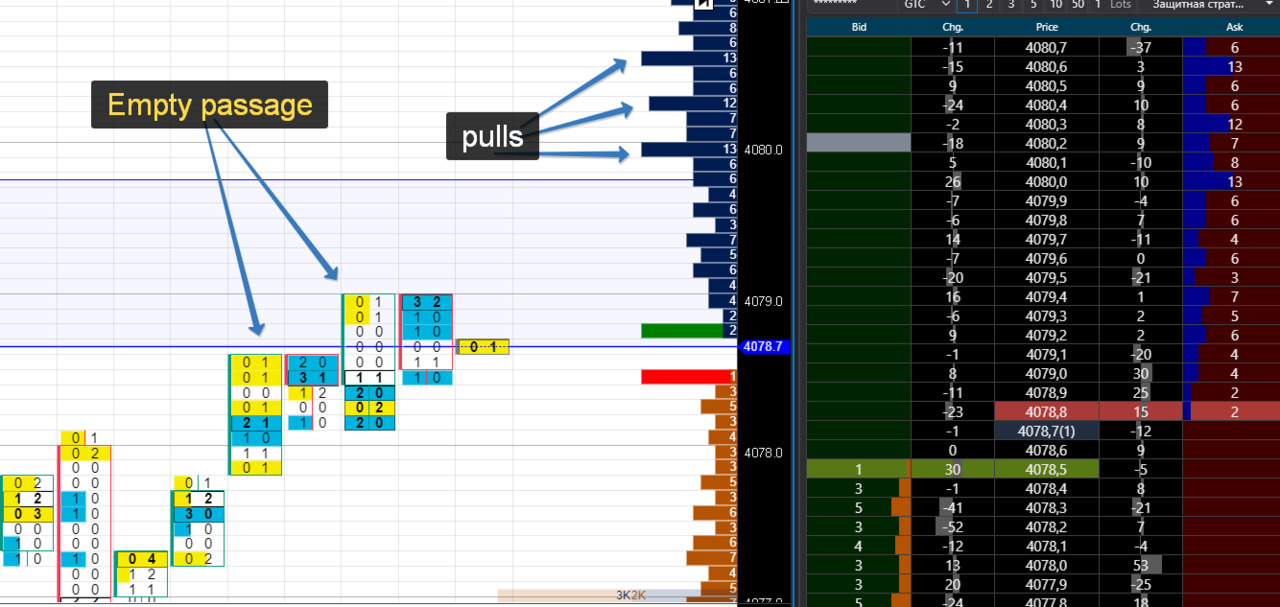
2) “Empty pass-through”
Essence. Price “rings through” several ticks almost without resistance.
Signs:
— DOM: simultaneous pulls on the defending side (L1–L3 thin out quickly with no trades).
— T&S: a series of one-directional prints; the spread often widens.
What it means. Liquidity is fleeing the hit; the defending side does not want to get filled — the level gives way.
Context / risks. After a fast breakout, a brief pause or pullback (exhaustion) often follows. Check whether limit orders return to the level.
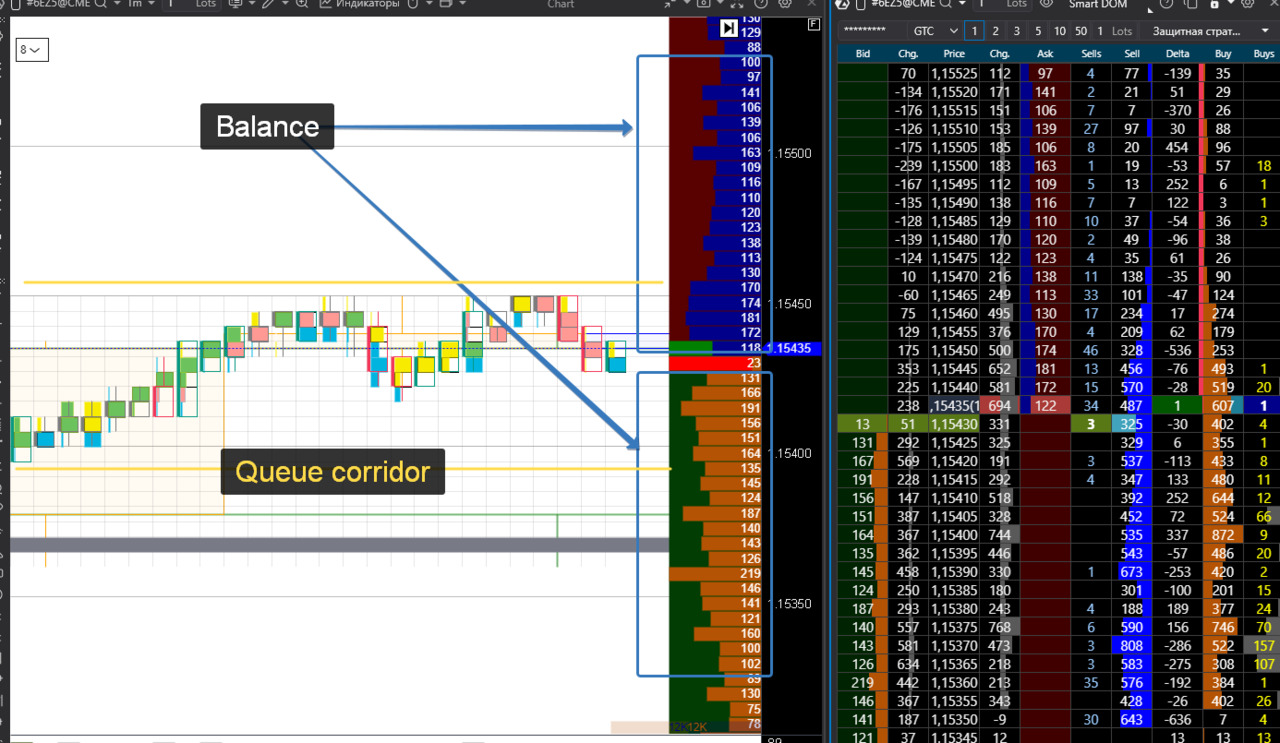
3) “Queue corridor”
Essence. Two active sides near the best price rapidly replenish levels, keeping the spread tight.
Signs:
— DOM: L1–L2 on both sides are constantly replenished (small, frequent stacks); the levels “flicker.”
— T&S: trades print, but price progress is weak — bar after bar with no clear displacement.
What it means. Two liquidity providers (or two families of algorithms) are maintaining balance: execution occurs, but price stays put.
Context / risks. This regime is easily broken by news or a large aggressor; exits from the corridor are usually sharp.
How to quickly distinguish these regimes
— Sticking: trades occur → the spread stays stable → the level is replenished.
— Empty pass: trades occur → the spread widens → levels disappear without prints.
— Corridor: trades occur → the spread is tight → levels on both sides are quickly replenished, with no price progress.
Common observation mistakes
— Confusing refresh (level replenishment after trades) with a “painted” wall: check T&S — with refresh there are trades; with “painting” there often aren’t.
— Treating any fast breakout as “strong” without checking whether liquidity returns after the sweep (exhaustion).
— Judging a static DOM snapshot: speed of stack/pull matters more than raw numbers.
These three pictures are everyday patterns of queue life. Seeing them in real time tells you who is acting now: absorbing, running away, or balancing.
What traders should watch: fast cues and recognizable scenes
1) Four things you constantly check
— How fast L1 melts.
— Eyeball it: do the first tens/hundreds of lots disappear in seconds, or do they hold?
— Melts fast → defense is weak.
— Holds → someone is absorbing flow.
— Repeated “resurrections” of a level (refresh).
— Count cycles of “hit → replenished.”
— 0–1 time → little real defense.
— 3+ in a row → likely iceberg/hidden volume.
— Where the weight is near price (L1–L5).
— Is there more cumulative size on Bid or Ask? Watch how weight shifts every 1–3 seconds.
— Weight shifts down (Bid) → support from below.
— Weight drains above (Ask) → the cap is thinning.
— Spread regime (tight / normal / wide).
— Tight (~1 tick) → cheap execution; multi-tick sweeps are rarer.
— Wide (≥2–3 ticks) → thin book; price is easy to push; expect more slippage.
2) Three scenes you learn to recognize in seconds
A. “Protective cap” (absorption)
— T&S: long series of buys at the Ask (or sells at the Bid).
— DOM: L1 replenishes after each hit; the spread does not widen.
— Conclusion: hidden/iceberg volume is present.
— Detail: many refresh cycles, slow L1 decay, weight stays on the defending side.
B. “Support break” (empty pass)
— T&S: accelerating one-sided prints.
— DOM: synchronized pulls on the defending side (L1–L3); wider spread.
— Conclusion: liquidity is running; the level gives way; a multi-tick sweep is possible.
— Detail: L1 melts fast, almost no refresh, weight vanishes where pressure hits.
C. “Queue corridor” (two-provider balance)
— T&S: trades print, but price makes little progress.
— DOM: both sides’ L1–L2 are frequently replenished in small amounts; tight spread.
— Conclusion: two active models hold equilibrium; the regime is fragile — news or a large hit can break it.
— Detail: mirrored replenishments, stable weight on both sides.
3) Mini-algorithm for scanning T&S and DOM (every 5–10 seconds)
— Spread: tight or wide? (costs and sweep risk)
— L1: melting fast or holding? any refresh cycles?
— L1–L5: where is weight shifting — toward Bid or Ask?
— Scene: “cap,” “break,” or “corridor”?
If you get:
— Tight spread + many refreshes + weight on defense → cap.
— Wide spread + pulls on defense + fast melting → support break.
— Tight spread + mirrored replenishments + no progress → corridor.
4) Common mistakes and how to avoid them
— Judging by a static number. Watch volume motion (stack/pull/match), not snapshots.
— Confusing cancels with executions. If volume drops but there are no prints, it’s a cancel, not consumption.
— Ignoring the spread. A wide spread alone can produce “false” 1–2 tick pokes.
— Not counting cycles. Two or three refreshes in a row are a signal; a single one is just noise.
Watch these four cues and cross-check with the tape — and the queue stops being abstract: you’ll see who is acting in the moment.
Conclusion
The queue is a mechanism for allocating executions among limit orders at a price level. Participants compete by time, size, and status (maker vs. non-maker), not by “being right.” Queue behavior is the result of their choices to add, remove, refresh, or absorb. By understanding priority rules and the dynamics of add/modify/cancel/match, we read participants’ intentions and risks before price moves — and see where a level is truly defended versus where it is only thin in a snapshot.
Market depth, liquidity asymmetry, walls and “ladders” (stacked liquidity)
The order book is not just the best L1 quotes, but the fabric of liquidity surrounding price: tiers of limit orders up and down the price ladder. The shape of this fabric (where it is dense or sparse), its skew between Bid and Ask, and pockets of large concentrations (“walls,” “ladders”) indicate where the market becomes heavy and slows down — and where it thins out and is ready to “sweep” ticks with little resistance.
Think of depth as a suspension bridge under price: if there are more planks on the left (a thicker Bid), the bridge holds from below; if there are gaps on the right (a thin Ask), a step in that direction can produce a long “drop.” Large volume blocks are the bridge’s supports: some truly hold (willing to execute and refresh), others merely imitate support (they vanish on the first hit).
Dynamics matter: not the size itself, but how it changes under the tape’s pressure. If a level replenishes after hits, it is absorbing flow; if tiers wither synchronously before any trades, liquidity is running from the impact. This micro-mechanics is how we read “where it’s easier to go right now.”
And remember the limits of the picture: visible depth reflects intentions, not completed trades; some volume may be hidden (iceberg/hidden); session regime and spread width change the “cost of passage.” Therefore, read depth together with the tape and in real time, tracking the speed of stack/pull/match — only then does the book’s shape become a practical signal.
A) What depth is
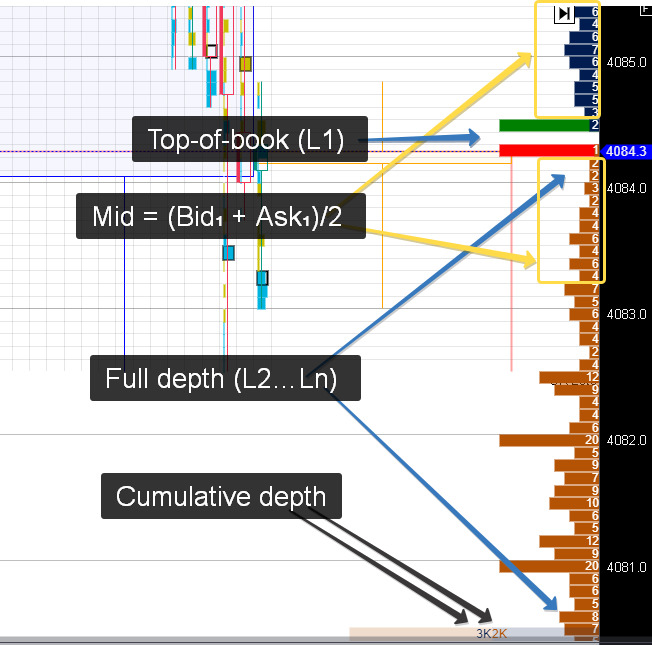
Top-of-book vs. full depth
— Top-of-book (L1) — the best quotes: the head of the buyer queue (Best Bid) and seller queue (Best Ask). This is the “edge of the market,” where the first encounters with aggression occur.
— Full depth (L2…Ln) — the entire visible price ladder on both sides: levels beyond L1 with their sizes. This is where context lives — where the market is thick or thin.
Cumulative depth
— Sum visible sizes across nearby tiers, e.g., L1–L5 or L1–L10, separately for Bid and Ask.
— This yields the side’s weight near price: the larger the sum, the harder it is for price to move quickly in that direction without trading through many levels.
— Track not only the level but the rate of change: rising fast → liquidity is being added; falling fast → liquidity is running.
Profile around the mid (local book shape)
— Mid = (Best Bid + Best Ask) / 2 — the axis between the best quotes.
— Inspect 2–5 levels above and below the mid:
— Denser tiers above → a forming cap (upward movement is harder).
— Denser tiers below → a bowl/support.
— Watch how the profile reacts to hits:
— After buys, upper tiers replenish → flow is being absorbed.
— Before an impulse, defending tiers thin synchronously → a multi-tick sweep is likely.
Quick on-screen checklist
— Bid L1–L5 vs. Ask L1–L5 totals (side weights).
— Where it’s denser right now — above or below the mid.
— How fast the weight changes in response to the tape (stack/pull).
B) Liquidity Asymmetry (Imbalance)
Idea. Simple: look at where there is more visible liquidity near the price — below (Bid) or above (Ask) — and how fast this relationship changes. This is not a “price prediction,” but an indicator of which side can push through the nearest ticks more easily right now.
1) Two fast imbalance metrics
— ΔDepth (L1–L5) = ΣBid — ΣAsk
— Positive → more “weight” below the price (support).
— Negative → more “weight” above the price (cap).
— It’s useful to track both the sign and the rate of change:
— — Δ increasing toward positive → bids are being added below;
— — Δ decreasing toward negative → offers are getting heavier above.
— Depth ratio = ΣBid / ΣAsk
— The ratio of side “weights.”
— — > 1: imbalance to the bid side;
— — <1: imbalance to the ask side.
— It’s more useful to watch the trend of the ratio than a single value.
Practice: L1–L5 is usually enough (sometimes L1–L10). Deeper levels rarely affect the “next ticks” over the next second or two.
2) Depth slope (where the “ball rolls”)
Compare how the steps grow as you move away from the price:
— Faster growth above → upward slope (price meets resistance on rises).
— Faster growth below → downward slope (support on pullbacks).
In dynamics: if the slope flips right after a burst of prints (e.g., steps above thin out while bids below build), the market is ready to let price move into the freed side.
3) Time of day and regimes (same numbers, different meaning)
— Morning/evening, overnight session: overall depth is thinner — significance thresholds are lower.
— News/auctions/volatility pauses: imbalances jump, spread widens; assess stability over 2–3 consecutive updates, not a single spike.
— Instrument specifics: on some contracts L1–L3 decide everything; on others L1–L10 matter more.
4) Reading asymmetry together with the tape
— Positive ΔDepth + buys on the tape, narrow spread → bids are absorbing; an upward push isn’t guaranteed, but it’s easier (if there’s no wall above).
— Negative ΔDepth + sells, widening spread → heavy above, thinning below — risk of a downside “flush.”
— ΔDepth flips sign right after a burst → participants rebuilt the book (pull/stack); price usually follows the freed ladder.
5) What a trader should watch (quick checklist)
— Sign of ΔDepth (L1–L5) and its rate of change.
— Depth ratio — is the trend rising or falling?
— Slope: where do steps build faster — above or below?
— Tape confirmation: are there trades in the direction of the assumed “easy path”?
— Spread: narrow → cleaner signal; wide → more false pokes.
In short: asymmetry is about readiness to absorb pressure in the nearest ticks. Watch the sign and speed of ΔDepth/ratio, the slope of the steps, and tape confirmation — and you’ll see in advance which side is easier to slip through right now.
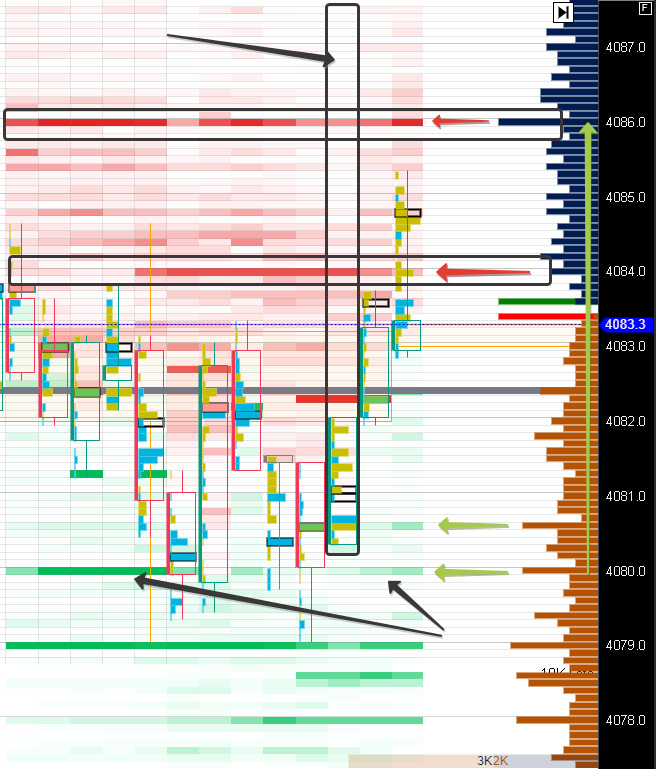
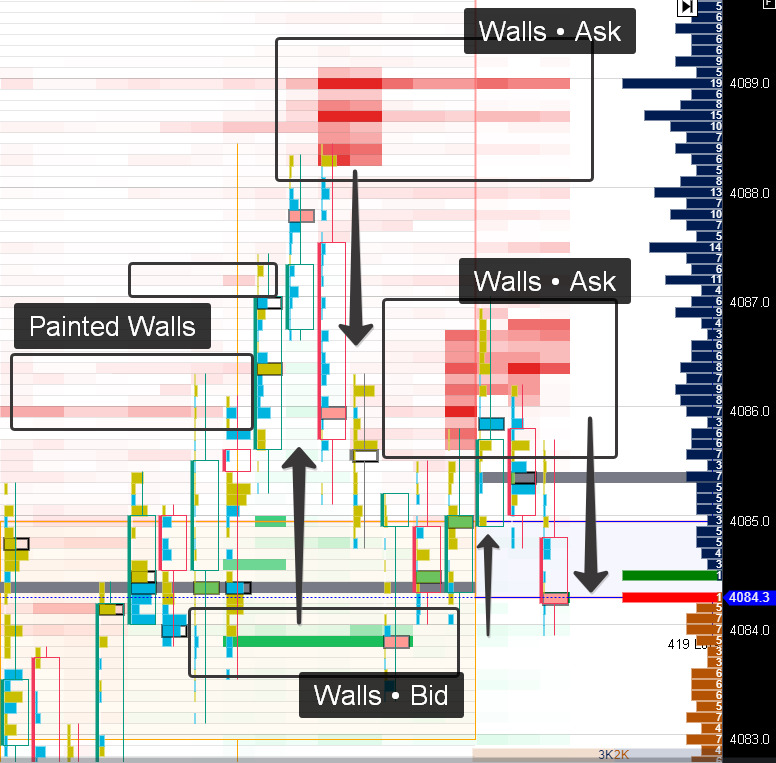
C) “Walls”
What they are. A “wall” is a large concentration of visible limit orders at a single price level. There are two types:
— Real walls — genuinely willing to execute and absorb flow.
— Painted walls — placed to influence market behavior but pulled when hit.
How to tell on screen (a quick 3-in-1 test)
— Are there trades at the wall price (T&S)?
— Consistent prints exactly at the wall price → point in favor of real.
— No prints, volume disappears “quietly” → looks like pulls (painted).
— Does the volume replenish (DOM → refresh)?
— After hits, size comes back (20 → 0 → 20 → 0 …), the “cap” repeats → iceberg/refresh, likely real.
— After a hit, size does not return → it was removed, likely painted.
— What does the spread do?
— Spread does not widen during a series of trades at the wall → the level is absorbing flow.
— Spread widens, nearby levels melt without prints → liquidity is fleeing.
Working rule:
Prints + refresh + stable spread = real wall.
No prints + pulls + widening spread = painted wall.
Dynamic behavior
— A real wall “holds” and sometimes “drifts.”
— It may accompany price by stepping one tick at a time: hold → shift one tick → hold again, etc.
— On the tape: trades at each new “step.”
— In the DOM: repeating refresh.
— A painted wall “bounces away.”
— Often retreats 1–2 ticks up/down as soon as aggression approaches: the big number vanishes without trades, with synchronous pulls nearby.
Examples (mirror for Bid/Ask)
— Ask wall (above).
— Buys hit the Ask; T&S shows prints at the wall price; size on that Ask replenishes; spread stays tight.
— → The seller is absorbing flow (often an iceberg).
— Bid wall (below).
— Sells go into the Bid; prints occur exactly at the wall price; the Bid replenishes; spread doesn’t blow out.
— → The buyer is holding the level.
— Painted Ask.
— As buys approach, simultaneous pulls on the Ask and the next level up; no prints; spread widens → the wall was removed, price “probes” upward.
What the trader should watch (step-by-step)
— Price approaches a big number → immediately check T&S:
— Are there series of trades at that price (not just nearby)?
— Watch DOM changes:
— Does size reappear (refresh) after each hit?
— Check the spread:
— Does it stay tight or widen during the hits?
— Neighboring steps:
— Is there a “ladder” behind the wall, or emptiness? (If empty, the breakout will be sharper.)
Common mistakes
— Buying a single big number. Always demand tape confirmation. Big DOM without prints is not protection.
— Confusing refresh with “painting.” With refresh, trades occur; with painting, size is simply pulled.
— Ignoring regime. On a wide spread, even a real wall may let a tick or two through — that’s book breathing.
— Ignoring context. Check what’s behind the wall: emptiness → faster move on break; a ladder → stepwise move.
Why this matters
— A real wall shows where significant flow is being absorbed — an area for accumulation/distribution.
— A painted wall distorts expectations; its goal is to influence others, not to execute.
By distinguishing them via the three signals (prints, refresh, spread), you gauge the current strength of a level and the likelihood of a near-term “flush” through the next ticks.
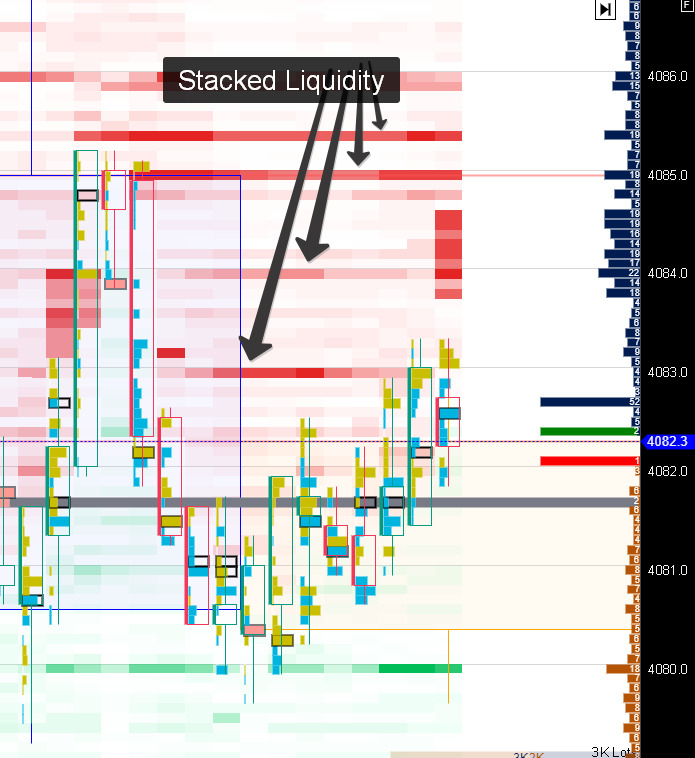
D) “Ladders” (stacked liquidity)
What they are. A “ladder” is a series of repeating blocks of visible limit orders placed every N ticks on one side of the book (above price — sellers, below — buyers). Steps can be roughly equal in size (e.g., 200–200–200 lots every 2 ticks) or form a “fan” (300 → 250 → 200).
Why ladders appear
— Trend accompaniment (“behind price”).
— A large participant guides a trend by layering buys under a rising price (or sells above a falling price) to add on pullbacks without pushing the market with a single large order.
— Braking (“ahead of price”).
— Steps are placed into the move to cool momentum, stretch execution over time, and reduce adverse selection.
How they show up in the data
— DOM (order book):
— Repeating density at regular price intervals (e.g., every second or third tick). As price approaches a step, size is often partially consumed and then replenished (refresh).
— T&S (tape):
— Near a step — frequent partial fills at that price (many lines at one level).
— On a break — a burst of trades followed by acceleration to the next step (between steps is usually thinner).
— Spread:
— Typically stays tight while the ladder is accompanying or braking; may widen briefly at the moment the nearest step breaks.
Ladder behavior in dynamics
— Ladder behind price (accompaniment):
— Price pulls back → the step absorbs part of the flow → the remainder refreshes or the next step is placed closer. Result: a stepwise trend.
— Ladder ahead of price (braking):
— Price approaches a step → slowdown, many partial fills → either a pause/reversal, or a break and a quick run to the next step (often a “vacuum” between steps).
— Ladder shift:
— Steps are moved with price (cancel + add higher/lower) — a sign of intentional position management.
— If steps suddenly disappear without prints, it’s not accompaniment but an attempt to paint density.
Practical visual markers
— Level rhythm: Repeating spacing (every 1–3 ticks) and similar block sizes.
— Repeated absorption: Many trades at the level and periodic size reappearing — the step is willing to execute.
— Acceleration between steps: After one step breaks, price quickly “jumps” to the next.
How to distinguish a working ladder from a “painting”
— Working: Prints at step prices + visible refresh; steps don’t vanish synchronously as price approaches.
— Painted: Large numbers pull without trades, steps “melt” in advance, spread widens — meant to influence expectations, not to execute.
What the trader should watch
— Is there a repeating price step (every 1–3 ticks) with similar sizes
— Are trades occurring at the steps, and does size replenish after hits
— How does price behave between steps: accelerate or bog down
— Do steps evolve over time: move with price (accompaniment) or disappear (painting)
Typical mistakes
— Treating any sequence of big numbers as a ladder without tape/refresh confirmation.
— Ignoring spread context: on a wide spread, “stepwise” behavior can be mere book breathing.
— Not checking what’s behind the nearest step: emptiness there means a sharper acceleration on the break.
Conclusion. A ladder is structured liquidity. It creates stepwise trend accompaniment or predictable braking of a move. By spotting it in the DOM and T&S, you can better anticipate where price will slow — and where, after a break, it’s likely to accelerate toward the next step.
E) Depth dynamics (before / during / after)
1) Before the impulse — “preparing the path”
What you see:
— DOM (defending side): series of pulls at L1–L3 — levels thin out without trades.
— DOM (opposite side): levels aren’t replenished; the “ladder” becomes sparse.
— T&S: one-directional aggression in small clips (IOC pings) probing the path.
— Spread: tends to widen on impact.
Meaning: liquidity runs away from the hit, creating “voids” — price can sweep the nearest ticks with little resistance.
What to watch: synchronized pulls on 2–3 nearest levels, no refresh on the defending side, the first sequences of prints in one direction.
2) During accumulation — “absorption”
What you see:
— DOM (target level): regular stacks and refresh — size returns after each hit.
— T&S: many trades at one price or within a tight range, but little price progress.
— Spread: usually tight; the best quote holds (Ask or Bid doesn’t move away).
Meaning: an iceberg/hidden order is present — a participant is absorbing flow, quietly accumulating or distributing without showing a single large visible order.
What to watch: repeating “caps” (20→0→20…), steady prints at the same price, a stable spread. The more “hit → refill” cycles, the stronger the absorption.
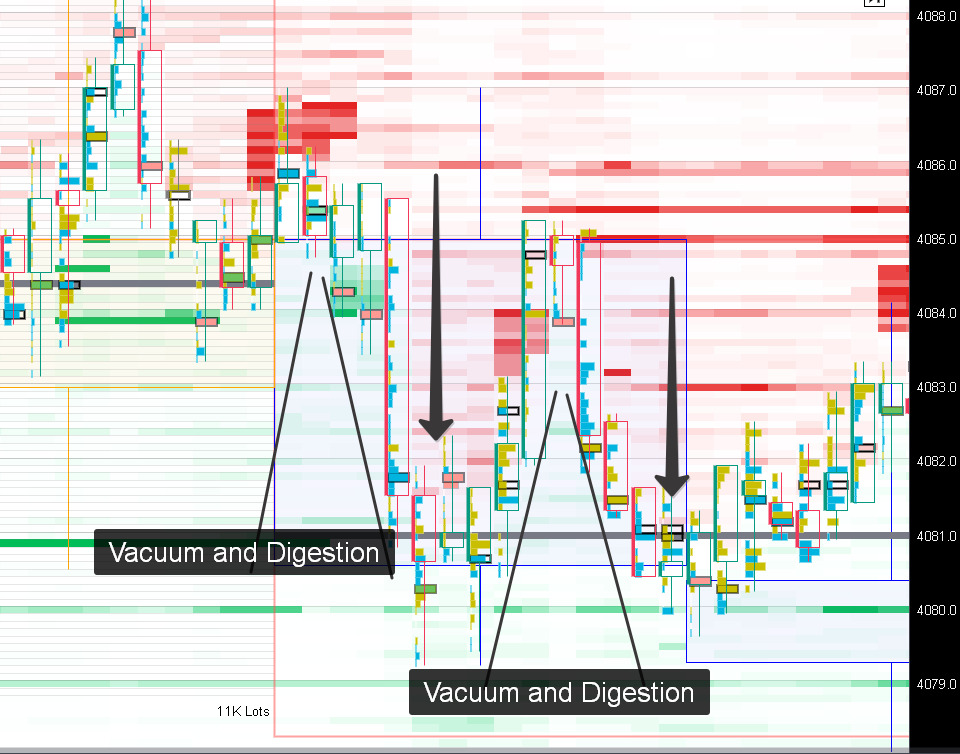
3) After the breakout — “vacuum and digestion”
What you see:
— DOM: immediately after the break — thin book; adjacent levels are sparse, the ladder is diluted.
— T&S: a short burst of one-directional trades followed by fading activity.
— Spread: often wide at the moment of the break, then narrows.
— Return of levels: after a few updates, new blocks begin to appear.
Meaning: the market hits exhaustion — the impulse has run out; time is needed to restore liquidity and decide whether to continue or pull back.
What to watch: new steps appearing behind the broken level, spread tightening, slowing print pace. Large blocks returning “behind price” signal acceptance/continuation; their absence increases the odds of a quick pullback to the broken level.
Quick phase-recognition checklist
— Pulls without prints on defense → Before the impulse.
— Prints present, level refills, spread tight → Absorption.
— After the break: thin and fast, then quiet → Exhaustion & digestion.
By reading these three phases via DOM ↔ T&S ↔ spread together, you can anticipate where a path is being prepared, where accumulation is taking place, and when an impulse has already burned out.
G) Common mistakes and caveats
Confusing history with the present
— Mistake: reading profiles/clusters as current defense.
— How to spot it: the DOM is already thin or shows fresh steps, while the profile looks “thick.”
— What to do: verify DOM + T&S now: are there active orders and trades at the “historical” level?
Drawing conclusions from a snapshot
— Mistake: one large number in the book = a “strong level.”
— How to spot it: on approach, the size flickers or disappears without prints.
— What to do: assess 1–3 seconds of dynamics — stacks/pulls/matches — not a single value.
Ignoring instrument specifics
— Mistake: comparing lot sizes across contracts “as is.”
— How to spot it: a “thick” level on a large-tick instrument turns out cheap in dollar terms.
— What to do: keep tick size / tick value in mind; compare levels in monetary terms.
Forgetting hidden liquidity (icebergs/hidden)
— Mistake: assuming a thin visible level is weak.
— How to spot it: long print sequences at one price, spread doesn’t widen, the level refills.
— What to do: confirm DOM with T&S; judge by behavior (prints + refresh).
Not accounting for data-provider aggregation
— Mistake: treating update “smoothness/noise” as a market fact.
— How to spot it: the same instrument “breathes” differently across terminals.
— What to do: know your platform’s DOM/T&S update rate and aggregation; if possible, cross-check with an alternative feed.
Ignoring session regime and news
— Mistake: using the same significance thresholds daytime, overnight, and during news.
— How to spot it: overnight any imbalance looks “huge”; during news the spread is wider and “empty passes” appear.
— What to do: normalize thresholds — looser overnight; during news assume wider spreads and more false pokes.
Confusing cancellations with executions / overvaluing “walls”
— Mistake: treating falling size as “eaten”; believing any big number.
— How to spot it: size drops in the DOM but there are no prints in T&S; a “wall” vanishes on first contact.
— What to do: distinguish cancel vs match (no prints → cancel); validate walls with prints at the wall price, refresh, and a stable spread; check what’s behind the wall (emptiness accelerates a break).
Queue imbalance (L1–L10) and microprice
Order book imbalance is a quick gauge of which side of the book is heavier near the price: below (Bid) or above (Ask). We compare the visible limit orders on the nearest levels (L1–L5/L10) to see where there is more “weight” to absorb incoming trades right now.
Microprice is an “instant centering” within the spread that accounts for this weight. If there is more volume below, the microprice shifts toward the Ask; if more above, toward the Bid. It does not predict a trend — it shows which direction is easier to nudge right now, all else equal.
Important: this is about a local imbalance and the probability of a short move, not a longer-term trend. In practice, we read these together with the DOM and the tape:
— positive imbalance + microprice closer to Ask → upward passage is easier, as long as there’s no real wall above;
— negative imbalance + microprice closer to Bid → downward passage is easier, unless there’s hidden support holding.
A) Basic definitions
1) Book levels L1–Ln
— L1 — best prices: Best Bid and Best Ask.
— L2, L3 … Ln — the next steps of the price “ladder” on both sides. The farther from L1, the less likely trades reach there immediately.
2) Side depth (weight near the price)
— Sum the visible volumes on the nearest levels:
— ΣBid (L1–5) — total buyer volume (below) on levels L1…L5.
— ΣAsk (L1–5) — total seller volume (above) on levels L1…L5.
— Where the sum is larger, the “cushion” is thicker and it’s harder for price to pass quickly.
3) Imbalance (OBI — Order Book Imbalance)
Compare side “weights” and normalize to the range [-1; +1].
— Local (L1 only):
— OBI₁ = (Bid₁ — Ask₁) / (Bid₁ + Ask₁)
— A fast “thermometer” right at the market edge.
— Cumulative (multiple levels):
— OBI{{ₖ}} = (ΣBid (L1–k) — ΣAsk (L1–k)) / (ΣBid (L1–k) + ΣAsk (L1–k))
— Smooths L1 flicker and captures the nearest liquidity “bowl.”
How to read OBI:
— closer to +1 → heavier below (nearby support),
— closer to – 1 → heavier above (nearby cap),
— around 0 → balance.
4) Intuition
If one side is thicker near the price:
— it’s harder to move quickly into that side (many visible limits),
— it’s easier to “probe” ticks away from it (the other side is thinner).
5) Two simple examples
Example A (upward bias):
ΣBid (L1–5) = 1200, ΣAsk (L1–5) = 800
OBI₅ = (1200 — 800) / (1200 +800) = +0.20
Meaning: nearby support below; all else equal, it’s easier to tick up than to drop.
Example B (downward bias):
ΣBid (L1–3) = 300, ΣAsk (L1–3) = 1500
OBI₃ = (300 — 1500) / (300 +1500) = – 0.67
Meaning: a cap above; all else equal, it’s easier to move down if there’s no hidden support.
Important: OBI reflects the current local imbalance over the nearest ticks. It’s not an hourly trend. Always read OBI together with the tape (are real trades occurring?) and the spread (tight/wide).
B) Calculation variants and when to use each
1) L1 only — OBI₁
Idea: compare volumes at the best prices (Bid₁ vs Ask₁).
When: tight spread (~1 tick), frequent updates, second-by-second decisions.
Pros: instant reaction at the market edge.
Cons: noisy (icebergs, reshuffling); easy to be fooled by fake walls or cancels without trades.
Hedge: always cross-check OBI₁ with T&S (are there trades at L1?) and watch the spread regime.
2) Cumulative — OBI₅ / OBI₁₀ (L1–5 or L1–10)
Idea: sum nearby levels and compare the “bowl weight.”
When: you need structure beyond the edge and want to smooth L1 flicker.
Pros: more stable; better reflects nearby liquidity weight.
Cons: significance thresholds depend on instrument/session; too wide (L1–20) dilutes the signal.
Practice: liquid futures — L1–5; thin markets — L1–3; very deep — L1–10.
3) Distance-weighted
Idea: nearer levels matter more (e.g., weight = 1/level), so L1 noise doesn’t dominate.
When: L3–L5 are meaningful but L1 is erratic (icebergs/frequent reshuffles); you want a balance of speed and stability.
Pros: captures the shape of the near book; reduces L1 flicker impact.
Cons: requires tuning weights per instrument (1/k, exponential, etc.).
Quick recommendations
— Sprint/scalp (tight spread): start with OBI₁, confirm with T&S.
— Need stability: use OBI₅ (or OBI₁₀ on deep instruments).
— L1 noisy, L3–L5 important: use a weighted variant.
— Always: normalize thresholds by session/instrument and cross-check with T&S — without prints, an imbalance can be “painted.”
C) Microprice: simple and to the point
Take the best prices and their sizes:
— Best Bid = B, size at Bid₁ = qB
— Best Ask = A, size at Ask₁ = qA
Formula:
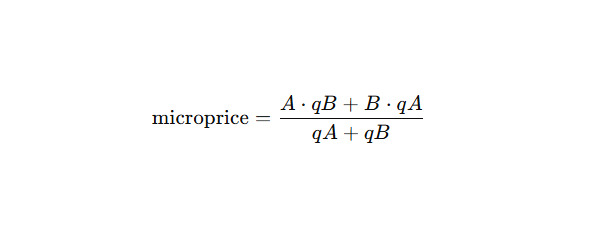
It is the “center of gravity” inside the spread: which side the market is currently pulled toward, given the visible thickness at L1.
How to read it at a glance
— Thicker below (qB> qA) → the center shifts upward → the microprice is closer to the Ask.
— Thicker above (qA> qB) → the center shifts downward → the microprice is closer to the Bid.
This is not a trend forecast, but an instant assessment of which direction it’s easier to make the next tick, all else being equal.
Quick example
— Bid = 100.00, Ask = 100.01
— qB = 900, qA = 300
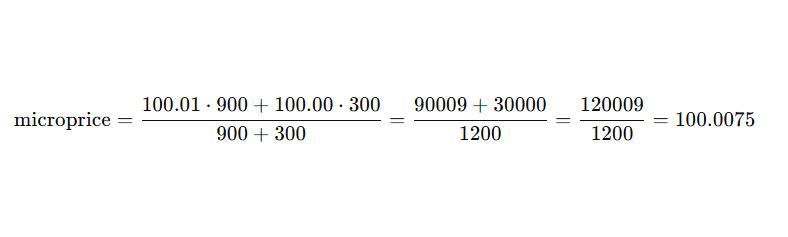
100.0075 — closer to the Ask, which means that right now an upward move is potentially easier (provided there is no real wall above the price).
When to look wider than L1
If L1 is “noisy” (icebergs, frequent re-quoting), replace qB / qA with cumulative volumes across several levels:
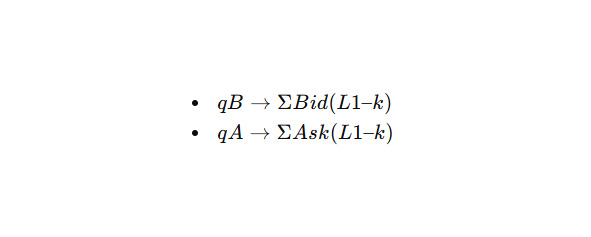
This way, microprice accounts for the nearby “bowl” of liquidity (L2–L5), not just the top of book.
Important caveats
— Wide spread (≥ 2–3 ticks): microprice is less informative — the “center” drifts in the empty space between the edges.
— Hidden liquidity: icebergs/hidden orders can distort the picture; confirm with T&S (are trades occurring on the “thin” side without the spread widening?).
— Data aggregation: update frequency and tick aggregation in your platform can smooth microprice moves — keep this in mind.
Бесплатный фрагмент закончился.
Купите книгу, чтобы продолжить чтение.